

Mode of Action of Toxin 6-Hydroxydopamine in SH-SY5Y Using NMR Metabolomics
- PMID: 40871504
- PMCID: PMC12388602
- DOI: 10.3390/molecules30163352
Mode of Action of Toxin 6-Hydroxydopamine in SH-SY5Y Using NMR Metabolomics
Abstract
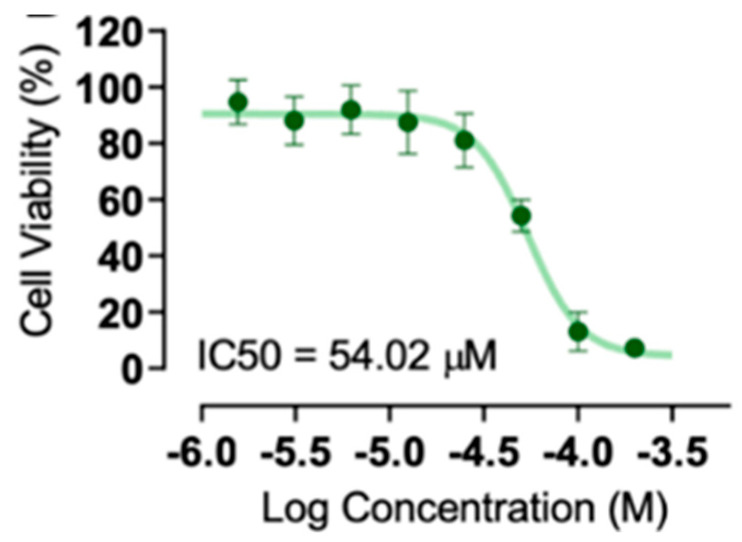
This study used NMR-based metabolomics to investigate the mode of action (MoA) of 6-hydroxydopamine (6-OHDA) toxicity in the SH-SY5Y neuroblastoma cell model. 6-OHDA, a structural analogue of dopamine, has been used to create a Parkinson's disease model since 1968. Its selective uptake via catecholaminergic transporters leads to intracellular oxidative stress and mitochondrial dysfunction. SH-SY5Y cells were treated with 6-OHDA at its IC50 concentration of 60 μM, and samples of treated and untreated groups were collected after 24 h. The endo metabolome was extracted using a methanol-water mixture, while the exo metabolome was represented by the culture media. Further, endo- and exo metabolomes of treated and untreated cells were analysed for metabolic changes. Our results demonstrated significantly high levels of glutathione, acetate, propionate, and NAD+, which are oxidative stress markers, enhanced due to ROS production in the system. In addition, alteration of myoinositol, taurine, and o-phosphocholine could be due to oxidative stress-induced membrane potential disturbance. Mitochondrial complex I inhibition causes electron transport chain (ETC) dysfunction. Changes in key metabolites of glycolysis and energy metabolism, such as glucose, pyruvate, lactate, creatine, creatine phosphate, glycine, and methionine, respectively, demonstrated ETC dysfunction. We also identified changes in amino acids such as glutamine, glutamate, and proline, followed by nucleotide metabolism such as uridine and uridine monophosphate levels, which were decreased in the treated group.
Keywords: 6-OHDA; ETC; NMR metabolomics; ROS; SH-SY5Y.
Conflict of interest statement
The authors declare no conflict of interest.
Figures


Similar articles
-
Prescription of Controlled Substances: Benefits and Risks.2025 Jul 6. In: StatPearls [Internet]. Treasure Island (FL): StatPearls Publishing; 2025 Jan–. 2025 Jul 6. In: StatPearls [Internet]. Treasure Island (FL): StatPearls Publishing; 2025 Jan–. PMID: 30726003 Free Books & Documents.
-
Resistance of HEK-293 and COS-7 cell lines to oxidative stress as a model of metabolic response.Acta Biochim Pol. 2025 Jun 12;72:14164. doi: 10.3389/abp.2025.14164. eCollection 2025. Acta Biochim Pol. 2025. PMID: 40574879 Free PMC article.
-
Impact of a Formulation Containing Chaga Extract, Coenzyme Q10, and Alpha-Lipoic Acid on Mitochondrial Dysfunction and Oxidative Stress: NMR Metabolomic Insights into Cellular Energy.Antioxidants (Basel). 2025 Jun 18;14(6):753. doi: 10.3390/antiox14060753. Antioxidants (Basel). 2025. PMID: 40563385 Free PMC article.
-
Management of urinary stones by experts in stone disease (ESD 2025).Arch Ital Urol Androl. 2025 Jun 30;97(2):14085. doi: 10.4081/aiua.2025.14085. Epub 2025 Jun 30. Arch Ital Urol Androl. 2025. PMID: 40583613 Review.
-
Signs and symptoms to determine if a patient presenting in primary care or hospital outpatient settings has COVID-19.Cochrane Database Syst Rev. 2022 May 20;5(5):CD013665. doi: 10.1002/14651858.CD013665.pub3. Cochrane Database Syst Rev. 2022. PMID: 35593186 Free PMC article.
References
MeSH terms
Substances
LinkOut - more resources
Full Text Sources
