. 2025 Aug 15;14(16):2545.
doi: 10.3390/plants14162545.

Phosphorus-Driven Stem-Biased Allocation: NPK Synergy Optimizes Growth and Physiology in Dalbergia odorifera T. C. Chen Seedlings

Affiliations

Phosphorus-Driven Stem-Biased Allocation: NPK Synergy Optimizes Growth and Physiology in Dalbergia odorifera T. C. Chen Seedlings

Mengwen Zhang et al. Plants (Basel). .

Abstract

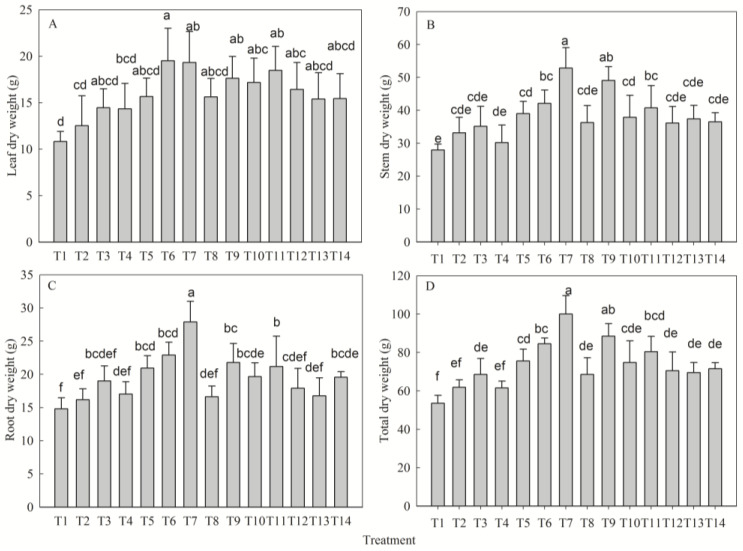
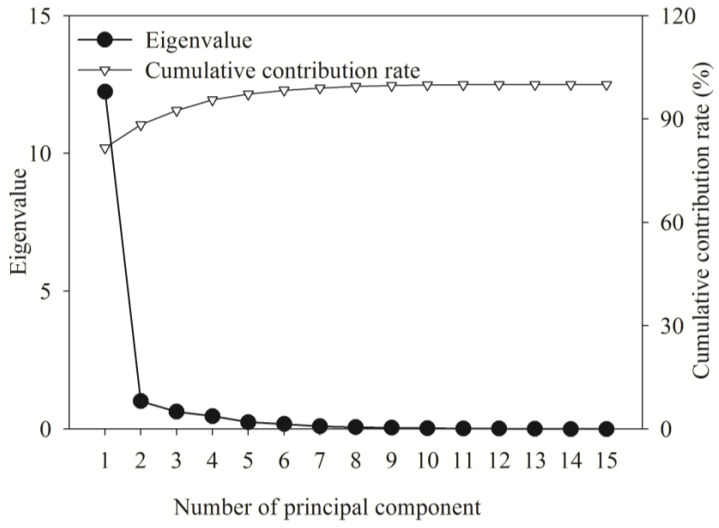
Valued for furniture, crafts, and medicine, Dalbergia odorifera T. C. Chen confronts critically depleted wild populations and slow cultivation growth, necessitating precision nutrient formulation to overcome physiological constraints. Using a '3414' regression design with four levels of N, P, and K, this study identified phosphorus (P) as the most influential nutrient in regulating growth (P > N > K). Maximal growth enhancement occurred under T7 (N2P3K2), with height and basal diameter increments increasing by 239% and 128% versus controls (p < 0.05). Both traits exhibited progressive gains with rising P but unimodal responses to N and K, initially increasing then declining. T7 boosted total biomass by 50% (p < 0.05) with stem-biased partitioning (stem > root > leaf; 52%, 26%, 22%). Photosynthetic capacity increased significantly under T7 (p < 0.05), driven by P-mediated chlorophyll gains (Chla + 70%; Chlb + 75%) and an 82% higher net photosynthetic rate. Metabolic shifts revealed peak soluble sugar in T7 (+139%) and soluble protein in T9 (+226%) (p < 0.05), associated primarily with P and K availability, respectively. Correlation networks revealed significant associations among structural growth, photosynthesis, and metabolism. Principal component analysis established T7 as optimal, defining a "medium-N, high-P medium-K" precision fertilization protocol. These findings elucidate a phosphorus-centered regulatory mechanism governing growth in D. odorifera, providing a scientific foundation for efficient cultivation.

Keywords: Dalbergia odorifera; cultivation; growth; physiology; “3414”fertilization.


Conflict of interest statement

The authors declare no conflicts of interest.

Figures

Figure 1
Figure 1
Effects of different fertilization treatments on height increment (A) and basal diameter increment (B) of Dalbergia odorifera T. C. Chen seedlings. Fertilization treatments: T1(N0P0K0), T2(N0P2K2), T3(N1P2K2), T4(N2P0K2), T5(N2P1K2), T6(N2P2K2), T7(N2P3K2), T8(N2P2K0), T9(N2P2K1), T10(N2P2K3), T11(N3P2K2), T12(N1P1K2), T13(N1P2K1), T14(N2P1K1). Data are presented as mean ± SE (n = 3 biological replicates, 3 seedlings per replicate). Different lowercase letters within each subplot indicate significant differences (p < 0.05) determined by one-way ANOVA with Duncan’s post hoc test.
Figure 2
Figure 2
Effect of different fertilization treatments on leaf dry weight (A), stem dry weight (B), root dry weight (C), and total dry weight (D) of D. odorifera seedlings. Fertilization treatments: T1(N0P0K0), T2(N0P2K2), T3(N1P2K2), T4(N2P0K2), T5(N2P1K2), T6(N2P2K2), T7(N2P3K2), T8(N2P2K0), T9(N2P2K1), T10(N2P2K3), T11(N3P2K2), T12(N1P1K2), T13(N1P2K1), T14(N2P1K1). Data are presented as mean ± SE (n = 3 biological replicates, 3 seedlings per replicate). Different lowercase letters within each subplot indicate significant differences (p < 0.05) determined by one-way ANOVA with Duncan’s post hoc test.
Figure 3
Figure 3
Effect of different fertilization treatments on chlorophyll a (A), chlorophyll b (B), and total chlorophyll (C) of D. odorifera seedlings. Fertilization treatments: T1(N0P0K0), T2(N0P2K2), T3(N1P2K2), T4(N2P0K2), T5(N2P1K2), T6(N2P2K2), T7(N2P3K2), T8(N2P2K0), T9(N2P2K1), T10(N2P2K3), T11(N3P2K2), T12(N1P1K2), T13(N1P2K1), T14(N2P1K1). Data are presented as mean ± SE (n = 3 biological replicates, 3 seedlings per replicate). Different lowercase letters within each subplot indicate significant differences (p < 0.05) determined by one-way ANOVA with Duncan’s post hoc test.
Figure 4
Figure 4
Effects of different fertilization treatments on net photosynthetic rate (A), stomatal conductance (B), transpiration rate (C), and intercellular CO2 concentration (D) of D. odorifera seedlings. Analysis indices: net photosynthetic rate (Pn), stomatal conductance (gs), transpiration rate (Tr), intercellular CO2 concentration (Ci). Fertilization treatments: T1(N0P0K0), T2(N0P2K2), T3(N1P2K2), T4(N2P0K2), T5(N2P1K2), T6(N2P2K2), T7(N2P3K2), T8(N2P2K0), T9(N2P2K1), T10(N2P2K3), T11(N3P2K2), T12(N1P1K2), T13(N1P2K1), T14(N2P1K1). Data are presented as mean ± SE (n = 3 biological replicates, 3 seedlings per replicate). Different lowercase letters within each subplot indicate significant differences (p < 0.05) determined by one-way ANOVA with Duncan’s post hoc test.
Figure 5
Figure 5
Effect of different fertilization treatments on soluble sugar (A) and soluble protein (B) content of D. odorifera seedlings. Fertilization treatments: T1(N0P0K0), T2(N0P2K2), T3(N1P2K2), T4(N2P0K2), T5(N2P1K2), T6(N2P2K2), T7(N2P3K2), T8(N2P2K0), T9(N2P2K1), T10(N2P2K3), T11(N3P2K2), T12(N1P1K2), T13(N1P2K1), T14(N2P1K1). Data are presented as mean ± SE (n = 3 biological replicates, 3 seedlings per replicate). Different lowercase letters within each subplot indicate significant differences (p < 0.05) determined by one-way ANOVA with Duncan’s post hoc test.
Figure 6
Figure 6
Heatmap depicting correlations among 15 parameters of D. odorifera seedlings across different fertilization treatments. * indicates significant correlation (p < 0.05), ** indicates extremely significant correlation (p < 0.01). Analysis indices: SHI (seedling height increment), BDI (basal diameter increment), LDW (leaf dry weight), SDW (stem dry weight), RDW (root dry weight), TDW (total dry weight), Chla (chlorophyll a), Chlb (chlorophyll b), Tchl (total chlorophyll), Pn (net photosynthetic rate), gs (stomatal conductance), Tr (transpiration rate), Ci (intercellular CO2 concentration), SSC (soluble sugar content), SPC (soluble protein content).
Figure 7
Figure 7
Principal component analysis of variance explained by fertilization on the growth of D. odorifera seedlings.
Figure 8
Figure 8
Component plots of principal component 1 and principal component 2. Analysis indices: SHI (seedling height increment), BDI (basal diameter increment), LDW (leaf dry weight), SDW (stem dry weight), RDW (root dry weight), TDW (total dry weight), Chla (chlorophyll a), Chlb (chlorophyll b), Tchl (total chlorophyll), Pn (net photosynthetic rate), gs (stomatal conductance), Tr (transpiration rate), Ci (intercellular CO2 concentration), SSC (soluble sugar content), SPC (soluble protein content).
Figure 9
Figure 9
Schematic diagram of the geographical location of the study area.

Similar articles

References

    1. Wasan S., Thanapat S., Saranya K., Jindarat E., Tadanori A., Sophon B. Growth Enhancement of the Highly Prized Tropical Trees Siamese Rosewood and Burma Padauk. Rhizosphere. 2021;19:100363. doi: 10.1016/j.rhisph.2021.100363. - DOI
    1. Yue X., Miao L., Yang F., Nawaz M. Morphological and Physiological Responses of Dalbergia odorifera T. Chen Seedlings to Different Culture Substances. PLoS ONE. 2020;15:e0232051. doi: 10.1371/journal.pone.0232051. - DOI - PMC - PubMed
    1. Wang Y., Xu J., Zhao W., Li J., Chen J. Genome-Wide Identification, Characterization, and Genetic Diversity of CCR Gene Family in Dalbergia odorifera. Front. Plant Sci. 2022;13:1064262. doi: 10.3389/fpls.2022.1064262. - DOI - PMC - PubMed
    1. Zhao X., Wang C., Meng H., Yu Z., Yang M., Wei J. Dalbergia odorifera: A Review of Its Traditional Uses, Phytochemistry, Pharmacology, and Quality Control. J. Ethnopharmacol. 2020;248:112328. doi: 10.1016/j.jep.2019.112328. - DOI - PubMed
    1. Zhang M., Chen F., Huang C., Lin L., Dong X., Chen L. Analysis of Resource Status and Site Conditions of Dalbergia odorifera Plantations in Hainan Province. Trop. For. 2024;52:52–57.

LinkOut - more resources