Review
. 2025 Aug 8;16(8):918.
doi: 10.3390/mi16080918.

Microrheology: From Video Microscopy to Optical Tweezers

Affiliations
Review

Microrheology: From Video Microscopy to Optical Tweezers

Andrea Jannina Fernandez et al. Micromachines (Basel). .

Abstract

Microrheology, a branch of rheology, focuses on studying the flow and deformation of matter at micron length scales, enabling the characterization of materials using minute sample volumes. This review article explores the principles and advancements of microrheology, covering a range of techniques that infer the viscoelastic properties of soft materials from the motion of embedded tracer particles. Special emphasis is placed on methods employing optical tweezers, which have emerged as a powerful tool in both passive and active microrheology thanks to their exceptional force sensitivity and spatiotemporal resolution. The review also highlights complementary techniques such as video particle tracking, magnetic tweezers, dynamic light scattering, and atomic force microscopy. Applications across biology, materials science, and soft matter research are discussed, emphasizing the growing relevance of particle tracking microrheology and optical tweezers in probing microscale mechanics.

Keywords: atomic force microscopy; diffusing wave spectroscopy; dynamic light scattering; magnetic tweezers; microrheology; optical tweezers; rheology; video particle tracking.


Conflict of interest statement

The authors declare no conflicts of interest.

Figures

Figure 1
Figure 1
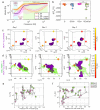
Past (top (a,b), adapted with permission from IOP Publishing, Ltd., reference [5] published in 2005) and current (bottom) accessible ranges of frequencies and magnitudes of viscoelastic moduli obtained from different microrheology methods including passive video particle tracking microrheology (PVPTM) [16,17,18,19,20], magnetic tweezers (MT) [21,22], optical tweezers (OT) [23,24,25,26,27,28], dynamic light scattering (DLS) [29,30,31,32], diffusing wave spectroscopy (DWS) [33,34,35,36,37,38,39], and atomic force microscopy (AFM) [40,41,42,43,44]. * Active and passive microrheology with OT share the same frequency range. ** Experimental results from transmission DWS are more commonly reported compared to back scattering DWS. (Colour-coded in both the diagrams.)
Figure 2
Figure 2
A schematic of the two-plate model for shear deformation.
Figure 3
Figure 3
Clustering of colloidal images in the (m0,m2) plane. 15,000 images of σ = 0.325 µm radius spheres. Reprinted with permission from Ref. [50]. Copyright 1996 Elsevier.
Figure 4
Figure 4
Stages of image processing. (a) Detail of a video micrograph of the (111) plane of a face-centred cubic colloidal crystal. The radius of each polystyrene sulfonate sphere is σ = 0.163 µm. The scale bar indicates 2 µm. (b) The same image filtered with the convolution kernel in Equation (21). (c) Grey-scale dilation of the image in (b). Dark spots represent the initial estimates for particle locations based on the neighbourhood maximum algorithm. (d) Final particle location estimates. The lines connecting sites constitute the network of nearest-neighbour bonds computed as a Delaunay triangulation (Preparata, F. P., and Shamos, M. I., “Computational Geometry.” Springer-Verlag, New York, 1985.) Such a network is useful as the basis of many measurements of local ordering. Reprinted with permission from Ref. [50]. Copyright 1996 Elsevier.
Figure 5
Figure 5
Multiple particle tracking microrheology measures random thermal motion of colloidal probe particles embedded in a soft material. Video microscopy images are processed to calculate individual trajectories. The ensemble average of the tracer mean-squared displacements is a measure of the material rheology by the Generalized Stokes–Einstein Relation. In the case shown, the material is gelling with time, leading to a series of curves ranging from a viscous liquid Δr2t ~ t to an elastic gel Δr2t ~ constant. The mean-squared displacement plot is reprinted with permission from T. H. Larsen and E. M. Furst, Phys. Rev. Lett., 2008, 100, 146001. Reprinted with permission from Ref. [10]. Copyright 2012 Royal Society of Chemistry.
Figure 6
Figure 6
Schematic diagrams of two common set-ups used in magnetic tweezers microrheology experiments: (a) two aligned pole-pieces set-up; (b) single-coiled magnetic tweezers. Reprinted with permission from Ref. [48]. Copyright 2018 John Wiley & Sons.
Figure 7
Figure 7
Schematic representations of different modus operandi of magnetic tweezers for microrheology studies: (a) single-cell mechanics via oscillatory, creep-compliance and twisting techniques; (b) oscillatory and creep-compliance experiments in viscoelastic media; (c) pulling and twisting methods applied to study the mechanical response of single molecules. Reprinted with permission from Ref. [48]. Copyright 2018 John Wiley & Sons.
Figure 8
Figure 8
The normalized position autocorrelation function Aτ and the normalized mean square displacement Πτ versus lag-time τ for an optically trapped particle suspended in water at room temperature. The continuous line is the theoretical prediction: Πτ=1Aτ=1eτt*, with t*=6πaηκ.
Figure 9
Figure 9
(Top, originally labelled as ‘D’ in the source publication.) Comparison between the shear viscosity ηγ˙ and the complex viscosity η*ω—derived from the frequency-dependent viscoelastic moduli—of a polyacrylamide solution. The agreement spans over five decades of shear rate and frequency. Reprinted with permission from Ref. [88]. Copyright 2023 AIP. (Bottom) (A,B) Viscoelastic response of actin–vimentin composite networks, highlighting the interplay between actin stiffness and vimentin extensibility. Reprinted with permission from Ref. [89]. Copyright 2024 Royal Society of Chemistry.
Figure 10
Figure 10
Determination of frequency-dependent viscoelastic moduli of peptide-RNA condensates using passive microrheology with optical tweezers (pMOT). (a) A bright-field image showing a polystyrene bead (1 µm) trapped within a [KGKGG]5-rU40 condensate using an optical trap. Scale bar = 10 µm. (b) A conceptual scheme of the pMOT experiment. The bead is optically trapped within a biomolecular condensate sitting on a microscope glass surface. (c) A representative 2D trajectory of the bead shown in (a) within the optical trap inside a [KGKGG]5-rU40 condensate. (d) The trajectory of the trapped bead in the X-direction. (e) Normalized distribution of displacements along the X- and Y-directions for the trajectory in (c,d). (f) The normalized position autocorrelation function [NPAF, A(t)] as calculated from the trajectory in (c) for a bead that is optically trapped inside [KGKGG]5-rU40 condensate (green and black) and inside water (blue) as a reference. Solid lines are multi-exponential fits (see Supplementary Note 1 of the original manuscript). (g) The average viscoelastic moduli as obtained from normalized position autocorrelation function using Equation (1) (of the original manuscript) for [KGKGG]5-rU40 condensates. G and G represent the elastic and viscous modulus, respectively. Solid lines are averages of the moduli of 10–20 condensates. Error bars represent the standard deviation as calculated from the moduli of 10–20 condensates. Inset: frequency-dependent condensate viscosity as determined from the viscous modulus using the relation ηω=Gωω. (h) The ensemble-averaged mean square displacement (MSD) of 200 nm polystyrene beads within [KGKGG]5-rU40 condensates using video particle tracking (VPT) microrheology in absence of optical traps (see Methods section for further details). (i) Comparison between the zero-shear viscosity as determined by pMOT- (n = 26 measurements over 3 independent samples) and VPT-derived (n = 7 measurements over 3 independent samples) viscosity. Error bars represent the range of the data. Reprinted with permission from Ref. [90]. Copyright 2021 Springer Nature.
Figure 11
Figure 11
Linear oscillatory microrheology. (A) An optically trapped microsphere is sinusoidally displaced through the sample while the force exerted on the bead is measured. (B) Sample data showing the position of the stage (which moves the trap relative to the sample) and the measured force during oscillation. The stage amplitude xmax, force amplitude Fmax, and phase shift Δϕ between the two curves for each frequency ω are measured to compute the linear viscoelastic moduli. (C) G′(ω) (closed symbols) and G″(ω) (open symbols) measured using this method for 1 mg/mL linear DNA of varying lengths (listed in legend). Reprinted with permission from Ref. [93]. Copyright 2014 ACS. (D) Equations relating measured quantities to viscoelastic moduli for a microsphere of a given radius R. Reprinted with permission from Ref. [92]. Copyright 2018 American Chemical Society.
Figure 12
Figure 12
DLS microrheology workflow. The polymer solution or gel precursor is mixed with a dilute concentration of tracer particles (<0.5% w/v). DLS is performed in a backscattering configuration using a commercial benchtop instrument. Brownian motion of the tracer particles produces fluctuations in scattering intensity that give rise to a characteristic scattering intensity autocorrelation. The autocorrelation is analyzed by our custom software to extract the mean-squared displacement of particles, which is used to determine the frequency-dependent linear viscoelastic shear modulus G*(ω). Reprinted with permission from Ref. [29]. Copyright 2017 American Chemical Society.
Figure 13
Figure 13
DLS microrheology captures the entangled dynamics of intestinal mucus of healthy and colitic mice. (Left): Dependence of the shear modulus G* on angular frequency ω of intestinal mucus isolated from healthy mice. The shear modulus exhibits three regimes, A, B, and C, which we identify as corresponding to reptation of polymers within an entangled network, elastic behaviour due to entanglement constraints, and Rouse-like flexible chain dynamics at length scales below the entanglement confinement length, respectively. Solid curves represent the mean among 3 independent biological reproductions. Shading represents 90% confidence intervals of the mean generated by bootstrap resampling spectra from independent biological reproductions. The dashed line represents the high-frequency scaling behaviour of a Rouse polymer G* ∼ ω1/2, which is provided to guide the eye. (Right): Comparison of the frequency-dependent shear modulus G* of intestinal mucus isolated from healthy (control) mice and mice treated with dextran sulphate sodium (DSS) to induce colitis. The high frequency scaling behaviours of a Rouse polymer and a WLC (G* ∼ ω1/2 and G* ∼ ω3/4, respectively) are indicated with dashed lines for reference. Reprinted with permission from Ref. [29]. Copyright 2017 American Chemical Society.
Figure 14
Figure 14
Dynamic shear moduli G′ and G″ of a 30 g/L NaHA solution in presence of 0.1 M NaCl obtained from DWS after inertial correction (G′ solid line, G″ dash-dotted line), oscillatory squeeze flow (G′ open squares, G″ open circles), and rotational rheometry (G′ closed squares, G″ closed circles) at T = 20 °C. The modulus of water G″ = ωηs is included for reference (dashed line). Reprinted with permission from Ref. [100]. Copyright 2013 American Chemical Society.
Figure 15
Figure 15
Fundamental principles of Atomic Force Microscopy (AFM)-based tissue mechanobiology. (A) Schematic describing the general AFM principles. An infrared laser is focused onto a soft microcantilever and its reflection is detected by a four-quadrant photodetector. When the microcantilever is in physical contact with the tissue specimen, the cantilever deflection is detected by the movement of the laser spot in the photodetector. (B) Diagram illustrating a typical force against Z-distance curve performed on a tissue specimen. The blue curve is the approach curve and indicates the resistance of the tissue to deform when the indenter is pushing against the tissue. The red curve is the retraction curve and indicates viscous relaxation and the adhesion of the tissue. (C) The illustrations indicated typical nanomechanical AFM-based mapping modalities used to measure the mechanical properties of tissues at high spatiotemporal resolution. (For interpretation of the references to colour in this figure legend, the reader is referred to the Web version of this article). Reprinted with permission from Ref. [101]. Copyright 2023 Elsevier.
Figure 16
Figure 16
The frontend of the open-access graphical user interface (GUI) developed by Haidar and Tassieri [107]. This code processes step-indentation measurements and provides the frequency-dependent viscoelastic moduli of the material. The stress-relaxation nanoindentation procedure involves approaching the sample surface, performing the indentation to a predefined depth, and holding it for a set duration while recording force deflection (red line). Subsequently, the cantilever is retracted from the surface.
Figure 17
Figure 17
Average relative viscosities between 1 and 3 µm away from cells in relation to cells volume. The diameter of each symbol is proportional to the extent of the viscous phycosphere. Horizontal dashed line represents predictions from Faxén’s law for motion perpendicular to a solid boundary (Equation (2)). Reprinted with permission from Ref. [108]. Copyright 2021 National Academy of Sciences.
Figure 18
Figure 18
(Left) A single frame showing a bead of ~ 4 µm radius trapped in gel and imaged at nine depths simultaneously. The top-left corner of each image reports the relative distance between that specific image plane and the plane in the centre (0), in multiples of the plane spacing Δz = 0.88 µm. The scale bar, shown in the central plane (0) is 10 µm. Contrast and brightness have been adjusted for clarity (MATLAB 2019b; MathWorks, Natick, MA, USA, https://uk.mathworks.com/products/matlab.html). (Right) (a) 3D scatter plot of the trajectory of a ~ 7 µm diameter bead confined in space by an optical trap (MATLAB 2019b; MathWorks, Natick, MA, USA, https://uk.mathworks.com/products/matlab.html). (b) Projections of the trajectory on the x–y and x–z planes. The bead trajectory is drawn from the image analysis of ~ 100,000 frames. (ce) show the x, y, and z position, respectively, of the bead with time over the length of the experiment. (f) The bead NMSD versus lag-time τ evaluated for each dimension. (g) The particle NPAF for each dimension plotted against a dimensionless lag-time τ*, derived from the scatter plots shown in (a). The solid line is at NPAF = e−1. Reprinted with permission from Ref. [109]. Copyright 2021 Springer Nature.
Figure 19
Figure 19
Data collection and interpretation. (a) Experimental procedure as described in text. Red and blue arrows denote radial and tangential directions, respectively. Yellow box shows region of interest. Scale bar in i is 10 µm. (b) Schematic side view of bead attached to cell. (c) Position–time trace from 1 measurement; the 18 min trace consists of 2,000,000 observations. (d) Experimental paradigm for change over time: two video measurements are taken 40 min apart with a drug being added after the first measurement, note that other measurements may have been made in this window, but only two are compared. (e) log–log plot with three example MSD curves: typical data from bead attached to cell, optically trapped bead, and bead attached to coverslip (to demonstrate noise floor). Three regions are highlighted for the cell MSD: (i) viscoelastic response at short time, (ii) soft glassy plateau at intermediate time with power-law exponent minima indicated by blue circle, and (iii) superdiffusion at long times. (f) Normalized complex modulus of a cell (Equation (3)), and of optical tweezers, calculated from the Fourier transform of the normalized MSD. Characteristic time scales found empirically are labelled one) and (f). (For interpretation of the references to colour in this figure legend, the reader is referred to the web version of this article.) Reprinted with permission from Ref. [63]. Copyright 2023 Elsevier.
Figure 20
Figure 20
Local stiffness measured in live 3D cell cultures with different compositions. (a) Complex moduli of plain gel in orange and gel supplemented with collagen in purple at day 1 (n = 11 for each condition averaged with 95% confidence intervals shown as shaded regions). (b) Proportional change in the height of the low frequency elastic plateau G0 (Equation (4) in Methods) at individual bead probes over three days of observation in plain gel (G) n = 11, gel with collagen (GCol) n = 11, gel seeded with cells (GCell) n = 13 and gel with collagen and cells (GColCell) n = 14. The dashed line represents no change; negative values indicate more compliant gels. Significance value ** p = 0.007, Kruskal-Wallis test. (c,d) Biomechanical maps produced by OptoRheo of MCF-7 clusters expressing tdTomato (shown in purple) encapsulated in hydrogels and (d). MCF-7 clusters from the same cell line in hydrogel supplemented with collagen I labelled with Cy5 (shown in green) monitored over three days. Spheres depict microsphere probes (not to scale) assigned a colour to reflect the local stiffness (G0). (e,f) Spatio-temporal changes in G0 values with relative distance from the edge of the cell clusters in gel in the absence (e) and presence (f) of collagen over three days. Reprinted with permission from Ref. [102]. Copyright 2023 Springer Nature.
Figure 21
Figure 21
(ad) Trajectory of a colloidal particle suspended in a Newtonian fluid and constrained by a toroidal optical trap with major radius Rˇ=5, small radius bˇ=1, and κz/κr=13. (eh) Similar simulation conditions to (ad), but exploring the effects of varying Rˇ on the MSD in (e), and on the normalized position autocorrelation function in the radial Art in (g). The inset in (g) shows the steady-state value of Art as a function of Rˇ. (f,h) show the effects of varying the ratio κz/κr on the MSD in (f), and on the normalized position autocorrelation function Azt, both only in the axial direction. The insets in (f,h) show the master curves for MSDz and Azt when the same data shown in the main are plotted against κzt/κr, respectively, and the MSDz is normalized by the variance of the optical trap in the z direction [26]. Reprinted with permission from Ref. [110]. Copyright 2024 MDPI.
Figure 22
Figure 22
(a) Schematic of microrheology experimental procedure. Dashed lines represent data at a force-loading rate of 0.2 μm/s and solid lines for 100 μm/s. Data in purple were analyzed to provide broadband mechanical response. (b) Schematic representation of the tweezer and chromosome positions from (a). (c) Opposing forces experienced at bead handles (one shown) in the non-equilibrium state. (d) Zoomed-in sub-region of the analyzed force at one bead and chromosome extension data. (e) Complex stiffness κ*ω with frequency (bottom axis in black) and lag time τ (top axis in green) from broadband microrheology (BM) of WT chromosomes at 100 μm/s (median and 95% CI; n = 14 chromosomes), highlighting regions of viscous reorganization and gel-like behaviour. Data in blue are the viscous modulus κω and in red are the elastic modulus κω. (f) κ*ω at 0.2 μm/s force-loading rate (median and 95% CI; n = 15 chromosomes) of WT chromosomes. (e) and (f) are both overlaid with oscillatory microrheology (OM) data from Meijering et al. (2022). Schematics shown are not to scale. Data are provided in a Source Data file. Reprinted with permission from Ref. [28]. Copyright 2025 Springer Nature.

Similar articles

References

    1. Einstein A. In: Investigations on the Theory of the Brownian Movement. Fürth R., editor. Dover Publications, Inc.; New York, NY, USA: 1956.
    1. Perrin J. Atoms. Constable; London, UK: 1916.
    1. Mason T.G., Weitz D.A. Optical Measurements of Frequency-Dependent Linear Viscoelastic Moduli of Complex Fluids. Phys. Rev. Lett. 1995;74:1250–1253. doi: 10.1103/PhysRevLett.74.1250. - DOI - PubMed
    1. Tassieri M. Microrheology with Optical Tweezers: Peaks & Troughs. Curr. Opin. Colloid Interface Sci. 2019;43:39–51. doi: 10.1016/j.cocis.2019.02.006. - DOI
    1. Waigh T.A. Microrheology of Complex Fluids. Rep. Prog. Phys. 2005;68:685–742. doi: 10.1088/0034-4885/68/3/R04. - DOI - PubMed

LinkOut - more resources