

SZC-6 Promotes Diabetic Wound Healing in Mice by Modulating the M1/M2 Macrophage Ratio and Inhibiting the MyD88/NF-χB Pathway
- PMID: 40872534
- PMCID: PMC12389266
- DOI: 10.3390/ph18081143
SZC-6 Promotes Diabetic Wound Healing in Mice by Modulating the M1/M2 Macrophage Ratio and Inhibiting the MyD88/NF-χB Pathway
Abstract
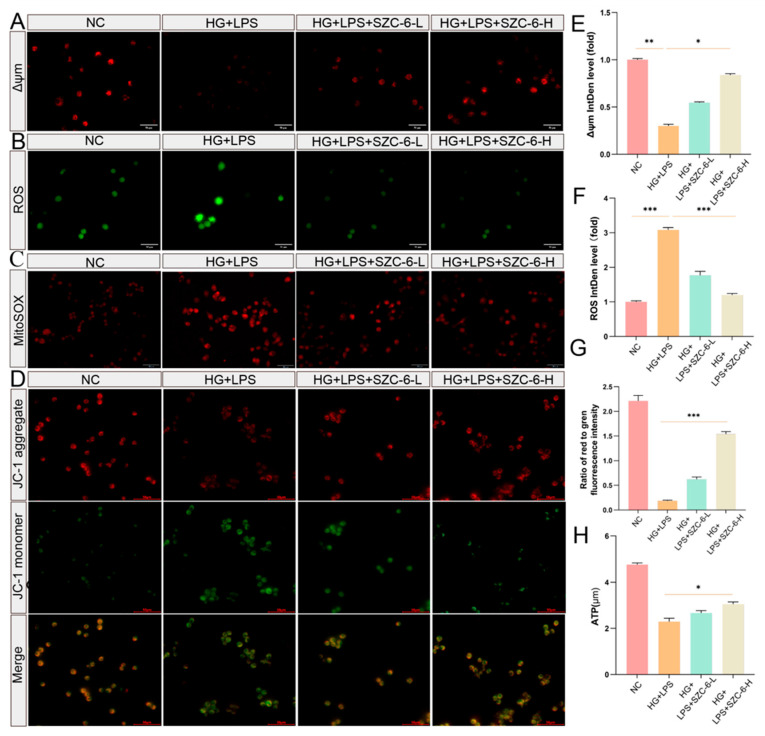
Background/Objectives: The prolonged M1-like pro-inflammatory polarization of macrophages is a key factor in the delayed healing of diabetic ulcers (DU). SIRT3, a primary mitochondrial deacetylase, has been identified as a regulator of inflammation and represents a promising new therapeutic target for DU treatment. Nonetheless, the efficacy of existing SIRT3 agonists remains suboptimal. Methods: Here, we introduce a novel compound, SZC-6, demonstrating promising activity levels. Results: SZC-6 treatment down-regulated the expression of inflammatory factors in LPS-treated RAW264.7 cells and reduced the proportion of M1 macrophages. Mitosox, IF, and JC-1 staining revealed that SZC-6 preserved cellular mitochondrial homeostasis and reduced the accumulation of reactive oxygen species. In vivo experiments demonstrated that SZC-6 treatment accelerated wound healing in diabetic mice. Furthermore, HE and Masson staining revealed increased neovascularization at the wound site with SZC-6 treatment. Tissue immunofluorescence results indicated that SZC-6 effectively decreased the proportion of M1-like cells and increased the proportion of M2-like cells at the wound site. We also found that SZC-6 significantly reduced MyD88, p-IκBα, and NF-χB p65 protein levels and inhibited the nuclear translocation of P65 in LPS-treated cells. Conclusions: The study concluded that SZC-6 inhibited the activation of the NF-χB pathway, thereby reducing the inflammatory response and promoting skin healing in diabetic ulcers. SZC-6 shows promise as a small-molecule compound for promoting diabetic wound healing.
Keywords: SZC-6; diabetic; macrophages; wound healing.
Conflict of interest statement
The authors declare that there are no conflicts of interest.
Figures


Similar articles
-
Mechanism of DT-13 regulating macrophages in diabetic wound healing.Cell Signal. 2024 Dec;124:111446. doi: 10.1016/j.cellsig.2024.111446. Epub 2024 Oct 2. Cell Signal. 2024. PMID: 39366531
-
Novel coumarin derivative SZC-6 as an allosteric activator of SIRT3 alleviates diabetic kidney disease via the SIRT3-Foxo3a signaling axis.Free Radic Biol Med. 2025 Aug 11;240:29-45. doi: 10.1016/j.freeradbiomed.2025.08.019. Online ahead of print. Free Radic Biol Med. 2025. PMID: 40803419
-
Leptin Enhances M1 Macrophage Polarization and Impairs Tendon-Bone Healing in Rotator Cuff Repair: A Rat Model.Clin Orthop Relat Res. 2025 May 1;483(5):939-951. doi: 10.1097/CORR.0000000000003428. Epub 2025 Feb 19. Clin Orthop Relat Res. 2025. PMID: 39982019
-
Topical antimicrobial agents for treating foot ulcers in people with diabetes.Cochrane Database Syst Rev. 2017 Jun 14;6(6):CD011038. doi: 10.1002/14651858.CD011038.pub2. Cochrane Database Syst Rev. 2017. PMID: 28613416 Free PMC article.
-
Dressings and topical agents for treating pressure ulcers.Cochrane Database Syst Rev. 2017 Jun 22;6(6):CD011947. doi: 10.1002/14651858.CD011947.pub2. Cochrane Database Syst Rev. 2017. PMID: 28639707 Free PMC article.
References
-
- International Diabetes Federation (IDF) Global Diabetes Atlas 11th Edition; Proceedings of the 2025 World Diabetes Congress; Bangkok, Thailand. 7–10 April 2025.
-
- Li Y., Su L., Zhang Y., Liu Y., Huang F., Ren Y., An Y., Shi L., van der Mei H.C., Busscher H.J. A Guanosine-Quadruplex Hydrogel as Cascade Reaction Container Consuming Endogenous Glucose for Infected Wound Treatment—A Study in Diabetic Mice. Adv. Sci. 2022;9:e2103485. doi: 10.1002/advs.202103485. - DOI - PMC - PubMed
Grants and funding
- 82301233/National Natural Science Foundation of China
- 2023A1515011931/Natural Science Foundation of Guangdong Province
- 2025A1515011032/Natural Science Foundation of Guangdong Province
- 2020A1515410003/Basic and Applied Basic Research Foundation of Guangdong Province
- 2023B1212060022/Guangdong Provincial Key Lab of Chiral Molecule and Drug Discovery
- SL2024A04J00715/Basic and Applied Basic Research Foundation of Science and Technology Projects in Guangzhou
- 2024ZZ08/Discipline training, innovation and quality improvement engineering team project of Guangdong Pharmaceutical University
- 2024QZ02/Discipline training, innovation and quality improvement engineering team project of Guangdong Pharmaceutical University
LinkOut - more resources
Full Text Sources
Miscellaneous
