. 2025 Aug 20;17(8):1141.
doi: 10.3390/v17081141.

The Tetraspanin CD9 Facilitates SARS-CoV-2 Infection and Brings Together Different Host Proteins Involved in SARS-CoV-2 Attachment and Entry into Host Cells

Affiliations

The Tetraspanin CD9 Facilitates SARS-CoV-2 Infection and Brings Together Different Host Proteins Involved in SARS-CoV-2 Attachment and Entry into Host Cells

Vanessa Rivero et al. Viruses. .

Abstract

CD9 protein belongs to a family of proteins called tetraspanins, so named for their four-transmembrane-spanning architectures. These proteins are located in domains in the plasmatic membrane, called tetraspanin-enriched microdomains (TEMs). Several proteases and cellular receptors for virus entry cluster into TEMs, suggesting that TEMs are preferred virus entry portals. Severe Acute Respiratory Syndrome coronavirus 2 (SARS-CoV-2) spike (S) protein mediates virus attachment and entry into cells by binding to human angiotensin-converting enzyme 2 (ACE-2). In addition, the secretory, type-I membrane-bound SARS-CoV-2 S protein is synthesized as a precursor (proS) that undergoes posttranslational cleavages by host cell proteases, such as furin and TMPRSS2. Moreover, it has been shown that neuropilin-1 (NRP1), which is known to bind furin-cleaved substrates, potentiates SARS-CoV-2 infectivity. Our results indicate that CD9 facilitates SARS-CoV-2 infection. In addition, we show how knocking out CD9 leads to a decrease in the expression of NRP1, a protein that improves SARS-CoV-2 infection. Furthermore, we show that CD9 colocalizes with ACE-2, NRP1, furin, and TMPRSS2 at the plasma membrane; that the absence of CD9 decreases the expression of these proteins on the plasma membrane CD9-enriched microdomains, and that CD9 interacts with ACE2. In conclusion, our data suggest that CD9 facilitates SARS-CoV-2 infection and that CD9 brings together different host proteins involved in SARS-CoV-2 attachment and entry into host cells, such as ACE2, NRP1, furin, and TMPRSS2. Importantly, the fact that a blocking antibody targeting CD9 can effectively reduce SARS-CoV-2 titers highlights not only the mechanistic role of CD9 in viral entry but also offers translational potential, suggesting that tetraspanin-targeting antibodies could be developed as therapeutic agents against SARS-CoV-2 and possibly other coronaviruses, with meaningful implications for clinical intervention.

Keywords: ACE2; CD9; NRP1; SARS-CoV-2; proteases TMPRSS2 and furin; tetraspanins; virus entry; virus-host interactions.


Conflict of interest statement

Author Daniel Torralba was employed by the PharmaMar S.A. The other authors declare no conflicts of interest.

Figures

Figure 1
Figure 1
The protein CD9 facilitates SARS-CoV-2 infection. SW480 and A549 WT and CD9 KO cells, previously generated, were used. (A) Cellular extracts from SW480 and A549 WT and CD9 KO cells were obtained, and Western blots with antibodies specific for CD9 and actin as control were performed. (B) The expression of CD9 was analyzed by flow cytometry in both SW480 and A549 WT and CD9 KO cells, using an anti-CD9-APC antibody. (C) The expression of CD9 was analyzed by immunodetection followed by fluorescence microscopy. To this end, A549/WT and A549/CD9 KO cells were fixed and permeabilized, and the cells were stained with an anti-CD9 antibody (in red). DAPI was used for nuclear staining (in blue). Representative images are included. (D) SW480 and A549-ACE-2 WT and CD9 KO cells were infected with SARS-CoV-2, and supernatants were collected at 24, 48, and 72 hpi. Viral titers were determined by a lysis plaque assay on Vero E6 cells. (E) SW480 and A549 WT cells were treated either with an antibody blocking the CD9 protein or with an isotype control antibody. Then, the cells were SARS-CoV-2 infected, and viral titers at 48 hpi were determined by a lysis plaque assay on Vero E6 cells. (D,E) Error bars represent the means and standard deviations (SD) of results from three independent experiments, including triplicate wells in each experiment. Ns, p > 0.05, * p < 0.05, ** p < 0.01, *** p < 0.001, **** p < 0.0001 (for comparison between WT and CD9 KO cells, in (D), and between cells treated with the control and the anti-CD9 antibodies, in (E), using an unpaired two-tailed Student’s t-test).
Figure 2
Figure 2
CD9 expression affects NRP1 expression levels. SW480/WT and SW480/CD9 KO cells were left mock infected or infected for 24, 48, and 72 hpi. (A) Protein extracts were obtained, and the levels of NRP1, ACE2, furin, TMPRSS2, and actin as control were analyzed by Western blot using specific antibodies. Two experiments were performed showing similar results. Representative blots from one out of two experiments are shown. Molecular weights (in kilodaltons) are indicated on the right. Western blots were quantified by densitometry using ImageJ software and normalized to the levels of actin in each sample (graphs on the right). For quantifications, the means and standard deviations of the two Western blots performed are represented. Ns, p > 0.05, * p < 0.05, ** p < 0.01, *** p < 0.001, (for comparison between WT and CD9 KO cells using an unpaired two-tailed Student’s t-test). (B) Total RNAs from mock-infected or SARS-CoV-2-infected SW480 cells were purified, and the expression level of ACE2, NRP1, furin, and TMPRSS2 mRNAs was quantified by reverse transcriptase (RT) reaction followed by qPCR, and quantified relative to the levels of β-actin mRNA. Error bars represent the means and standard deviations (SD) of results from three independent experiments, including triplicate wells in each experiment. Ns, p > 0.05 (for comparison between WT and CD9 KO cells using an unpaired two-tailed Student’s t-test).
Figure 3
Figure 3
NRP1 facilitates SARS-CoV-2 infection. A549-ACE2 WT cells were silenced with an siRNA specific for NRP1 or with a non-targeted (NT) siRNA as control. (A) Silencing efficiency was confirmed by Western blot in mock infected and SARS-CoV-2-infected cells after 24, 48, and 72 h post-infection, using an antibody specific for NRP1 and an antibody specific for actin as control. Two experiments were performed, showing similar results. (B) Human A549-ACE2 cells were transfected with a non-targeted (NT) or an NRP1-specific siRNA. At 24 h post-transfection, the cells were infected with SARS-CoV-2. Cell culture supernatants were collected at 24, 48, and 72 hpi and titrated by a lysis plaque assay on Vero E6 cells. Error bars represent the means and standard deviations (SD) of results from three independent experiments, including triplicate wells in each experiment. Ns, p > 0.05, * p < 0.05, ** p < 0.01, *** p < 0.001, **** p < 0.0001 (for comparison between cells transfected with the NT siRNA and the cells transfected with the NRP1 siRNA, using an unpaired two-tailed Student’s t-test).
Figure 4
Figure 4
CD9 localizes to the same transmembrane domains as ACE2, NRP1, furin, and TMPRSS2, and increases the expression levels of these proteins. To analyze whether CD9, ACE-2, NRP1, and the proteases are located in the same membrane microdomains, a fractionation experiment using the Brij98 detergent was performed. Lysates from SW480/WT and SW480/CD9 KO cells were layered beneath a discontinuous sucrose step gradient, from which 12 fractions were collected from top to bottom after overnight ultracentrifugation. (A) Western blot analysis, using antibodies specific for ACE-2, NRP1, furin, TMPRSS2, CD9, and flotillin as control, was performed using fractions containing the same amount of protein. The molecular weights are indicated on the right (in kilodaltons). The fraction numbers are indicated at the top. Three experiments were performed showing similar results. Representative blots from one out of three experiments are shown. (B) The fraction 3 of the Western blots, showing the highest protein amounts, was quantified by densitometry using ImageJ software. The amounts of ACE2, NRP1, furin, TMPRSS2, and CD9 were normalized by the amount of flotillin in fraction 3 in WT and CD9 KO cells. For quantifications, the means and standard deviations from the three Western blots performed are represented. * p < 0.05, ** p < 0.01, *** p < 0.001, **** p < 0.0001 (for comparison between WT and CD9 KO cells using an unpaired two-tailed Student’s t-test).
Figure 5
Figure 5
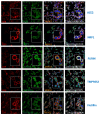
CD9 partially colocalizes with furin, TMPRSS2, NRP1, and ACE2. SW480-WT cells were fixed, permeabilized, and stained with antibodies specific for CD9, together with antibodies specific for ACE-2, NRP1, TMPRSS2, furin, and flotillin, as control. CD9 is shown in red; ACE2, NRP1, furin, TMPRSS2, and flotillin are shown in green; and nuclei were stained with DAPI and shown in blue. Areas of colocalization of both proteins appear in yellow in the third picture and in white in the fourth picture.
Figure 6
Figure 6
CD9 is in close proximity to NRP1 and furin. (A) Schematic representation of the proximity ligation assay (PLA) technique (DuoLink). PLA detects protein-protein interactions when two target proteins are within less than 40 nm of each other. Primary antibodies bind to each target protein, and species-specific secondary antibodies are conjugated to unique oligonucleotides. If the proteins are in close proximity, the oligonucleotides are ligated and amplified via rolling circle amplification, generating a fluorescent signal (visualized as red dots). (B) Representative images and quantification of PLA signals between CD9 and ICAM-1 in WT and CD9 KO SW480 (left) and A549-ACE2 (right) cells. (CD) Representative PLA images showing interactions between CD9 and candidate SARS-CoV-2 entry factors (NRP1, ACE2, Furin, and TMPRSS2) in SW480/WT (C) and A549-ACE2/WT (D) cells. Nuclei are stained with DAPI (blue). Quantification of average PLA signals per cell is shown on the right of the images. Loss of PLA signal in CD9 KO cells confirms the specificity of the CD9 interactions (see Supplementary Figure S3). For all images, the quantification of the average PLA signal per cell is shown to the right. For each condition, 10 images were acquired at 40× magnification, with each image containing between 80 and 120 cells.
Figure 7
Figure 7
CD9 binds ACE2. (A,B) Human 293T-ACE2 cells were transiently co-transfected with a pcDNA3.1 plasmid encoding CD9 or with an empty plasmid. Alternatively, A549-ACE2/WT and A549-ACE2/CD9 KO cells were used. (A) The expression of CD9 and ACE2 was analyzed by Western blot in the cellular extracts. Molecular weights (in kilodaltons) are indicated on the right. (B) Cellular lysates were used for co-immunoprecipitation assays using an anti-CD9 antibody and dynabeads-conjugated protein G to pull down CD9. After the immunoprecipitation, CD9 and ACE2 were detected by Western blotting using antibodies specific for CD9 and ACE2. Molecular weight markers (in kilodaltons) are indicated on the right. The upper band in the anti-CD9 blot in (B) corresponds to the light chain of the antibody used for the co-IP (marked with an *). The band corresponding to the CD9 protein has been indicated with an arrow.

Similar articles

References

    1. Lan J., Ge J., Yu J., Shan S., Zhou H., Fan S., Zhang Q., Shi X., Wang Q., Zhang L., et al. Structure of the SARS-CoV-2 Spike Receptor-Binding Domain Bound to the ACE2 Receptor. Nature. 2020;581:215–220. doi: 10.1038/s41586-020-2180-5. - DOI - PubMed
    1. Letko M., Marzi A., Munster V. Functional Assessment of Cell Entry and Receptor Usage for SARS-CoV-2 and Other Lineage B Betacoronaviruses. Nat. Microbiol. 2020;5:562–569. doi: 10.1038/s41564-020-0688-y. - DOI - PMC - PubMed
    1. Shang J., Wan Y., Luo C., Ye G., Geng Q., Auerbach A., Li F. Cell Entry Mechanisms of SARS-CoV-2. Proc. Natl. Acad. Sci. USA. 2020;117:11727–11734. doi: 10.1073/pnas.2003138117. - DOI - PMC - PubMed
    1. Shang J., Ye G., Shi K., Wan Y., Luo C., Aihara H., Geng Q., Auerbach A., Li F. Structural Basis of Receptor Recognition by SARS-CoV-2. Nature. 2020;581:221–224. doi: 10.1038/s41586-020-2179-y. - DOI - PMC - PubMed
    1. Walls A.C., Park Y.-J., Tortorici M.A., Wall A., McGuire A.T., Veesler D. Structure, Function, and Antigenicity of the SARS-CoV-2 Spike Glycoprotein. Cell. 2020;181:281–292.e6. doi: 10.1016/j.cell.2020.02.058. - DOI - PMC - PubMed

LinkOut - more resources