. 2025 Mar 7;5(4):e20230178.
doi: 10.1002/EXP.20230178. eCollection 2025 Aug.

Enhanced Blood-Brain Barrier Penetrability of BACE1 SiRNA-Loaded Prussian Blue Nanocomplexes for Alzheimer's Disease Synergy Therapy

Affiliations

Enhanced Blood-Brain Barrier Penetrability of BACE1 SiRNA-Loaded Prussian Blue Nanocomplexes for Alzheimer's Disease Synergy Therapy

Xiaoyuan Ding et al. Exploration (Beijing). .

Abstract

Amyloid-β (Aβ) deposition was an important pathomechanisms of Alzheimer's disease (AD). Aβ generation was highly regulated by beta-site amyloid precursor protein cleaving enzyme 1 (BACE1), which is a prime drug target for AD therapy. The silence of BACE1 function to slow down Aβ production was accepted as an effective strategy for combating AD. Herein, BACE1 interfering RNA, metallothionein (MT) and ruthenium complexes ([Ru(bpy)2dppz]2+) were all loaded in Prussian blue nanoparticles (PRM-siRNA). PRM-siRNA under near-infrared light irradiation showed good photothermal effect and triggered instantaneous opening of blood-brain barrier (BBB) for enhanced drug delivery. BACE1 siRNA slowed down Aβ production and Cu2+ chelation by metallothionein (MT) synergistically inhibited Aβ aggregation. Ruthenium (Ru) could real-timely track Aβ degradation and aggregation. The results indicated that PRM-siRNA significantly blocked Aβ aggregation and attenuated Aβ-induced neurotoxicity and apoptosis in vitro by inhibiting ROS-mediated oxidative damage and mitochondrial dysfunction through regulating the Bcl-2 family. PRM-siRNA in vivo effectively improved APP/PS1 mice learning and memory by alleviating neural loss, neurofibrillary tangles and activation of astrocytes and microglial cells in APP/PS1 mice by inhibiting BACE1, oxidative damage and tau phosphorylation. Taken together, our findings validated that BACE1 siRNA-loaded Prussian blue nanocomplexes showed enhanced BBB penetrability and AD synergy therapy.

Keywords: Alzheimer's disease; BACE1; Prussian blue nanoparticles; amyloid‐β; blood‐brain barrier.


Conflict of interest statement

The authors declare no conflicts of interest.

Figures

SCHEME 1
SCHEME 1
Synthesis route and proposed signal mechanism of PRM‐siRNA NPs against AD.
FIGURE 1
FIGURE 1
Characterization of PB NPs and PRM‐siRNA. Physicochemical properties of PRM‐siRNA. (A,B) SEM images and TEM images of (C) PB NPs respectively. (D,E) EDX mapping analysis of PB NPs. (F,G) SEM images and TEM images of (H) PRM‐siRNA NPs, respectively. (I,J) Mapping analysis of PRM‐siRNA NPs. (K) FT‐IR spectra of PB NPs and PRM‐siRNA NPs. (L) UV–vis absorption spectra of PB NPs, M‐siRNA (MT‐siRNA) and PRM‐siRNA NPs. (M) Fluorescence changes of Aβ fibrils and different NPs binding solutions. (N) Relative fluorescence intensity changes. (O) Fluorescence changes of Aβ fibrils combined with different NPs in PC12 cells. Each value represents the mean standard deviation (n = 3). (P) XRD analysis of PRM‐siRNA NPs. (Q) XPS analysis of PRM‐siRNA NPs. (R) Agarose gel retardation assay of PRM‐siRNA NPs. (S) Changes in normalized ThT fluorescence of preformed Aβ aggregates were incubated with different concentrations of nanoparticles for 48 h at 30°C. (T) The normalized ThT fluorescence of Aβ aggregates in the presence of PR (30 µM) and PRM‐siRNA NPs (30 µM) under different incubation durations. (U) Change of free Cu ion concentration in solution within 1 h after adding PRM‐siRNA NPs. C 0 is the initial concentration of Cu ion, and C is the concentration of Cu ion at different time points. (V) Fibrillation kinetics of Aβ42 monomer by the development of ThT binding in the presence of PR, PRM, and PRM‐siRNA NPs under NIR or without NIR illumination. (W) The percentage of soluble Aβ42 monomer with different nanoparticles and different concentrations of nanoparticles incubated at 30°C for 48 h. (X) DLS measures the change in particle size after treatment with different drugs. The average particle size of Aβ aggregates is about 900–1000 nm, and the particle size after drug treatment is about 150 nm, which is similar to the particle size of the drug itself.
FIGURE 2
FIGURE 2
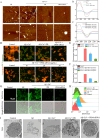
PRM‐siRNA reduced the Aβ fibrosis in cells. (A) AFM analysis of Aβ aggregation in the presence or absence of PR and PRM‐siRNA. Aβ was incubated with different nanomaterials for 48 h, the morphological changes of Aβ aggregates were observed using an AFM. The red box indicates the region where the Aβ aggregates are amplified. CD spectroscopy analysis of Aβ fibril secondary structure: (B) Changes in Aβ secondary structure after 48 h incubation at 37°C in the presence or absence of PR and PRM‐siRNA were monitored by CD spectroscopy. (C) Changes in Aβ secondary structure after 48 h incubation at 37°C in the presence of different concentrations of PRM‐siRNA. (D) Fluorescence images and (E,F) fluorescence intensity of the effect on mitochondrial membrane potential of PC‐12 cells in the presence of mixtures of Aβ, Aβ+Cu2+ and Aβ/NPs and different concentrations of PRM‐siRNA. Green fluorescence indicates JC‐1 monomer, which indicates low mitochondrial membrane potential. Red fluorescence indicates JC‐1 aggregation, indicating a high mitochondrial membrane potential. (G) Fluorescence image of ROS generation in PC‐12 cells in the presence of a mixture of Aβ, Aβ+Cu2+ and Aβ/NPs with DCFH‐DA as a fluorescent probe. (H) ROS changes in PC12 cells detected by flow cytometry. (I) TEM images of PC12 cells after 12 h of treatment with different NPs. The blank group was treated with PBS. Each value represents the mean standard deviation (n = 3).
FIGURE 3
FIGURE 3
PRM‐siRNA inhibited Aβ‐induced apoptosis PC12 cells. (A) Effect of Aβ monomers on PC12 cell viability in the absence and presence of Cu2+, PB and PRM‐siRNA. (*p < 0.05, **p < 0.01, compared to control groups). (B) Dynamic monitoring of the cytotoxicity using the xCELLigence RTCA system. (C) Live/Dead cells assay. Cells were treated with Aβ fibers and/or different concentrations of PRM‐siRNA for 24 h, and then fluorescent microscopic images of PC12 cells were obtained by LIVE‐DEAD staining. (D) Cell apoptosis detection. Cells after treatment were analyzed by Annexin V/PI staining with flow cytometer. Each value represents the mean standard deviation (n = 3).
FIGURE 4
FIGURE 4
PRM‐siRNA attenuated primary neurons apoptosis by inhibiting ROS‐mediated oxidative damage, mitochondrial dysfunction and regulating Bcl‐2 family. (A) Tubulin staining for neural morphological detection. Primary neurons were treated with 20 µg mL−1 of PRM‐siRNA and 20 µM Aβ42 for 48 h, changes in neuronal morphology were observed by Tubulin under fluorescence microscopy. (B) Aβ42‐induced neuronal toxicity. (C) Cytotoxicity of PRM‐siRNA towards neurons. (D) PRM‐siRNA inhibited Aβ42‐induced neuronal toxicity. (E) PRM‐siRNA inhibited Aβ42‐induced ROS generation. (F) Aβ42 induced DNA damage in a time‐dependent manner. Protein expression was examined by western blotting. (G) PRM‐siRNA attenuated Aβ42‐induced DNA damage. (H) PRM‐siRNA inhibited Aβ42‐induced neuronal mitochondrial dysfunction. (I) PRM‐siRNA attenuated Aβ42‐induced abnormal expression of Bcl‐2 family proteins. (J) Aβ42 dose‐dependently affected the expression of Bcl‐2 family proteins. All experiments were done at least three times.
FIGURE 5
FIGURE 5
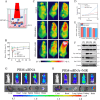
PRM‐siRNA under NIR showed enhanced BBB permeability. (A) Schematic diagram of the principle of Transwell or TEER (time‐dependent transendothelial cell resistance) measurement to evaluate the permeability of co‐cultured cells by measuring the top (inner chamber) and basal (outer chamber) chamber electrode resistance. The inner chamber cells are human umbilical vein endothelial cells and the outer chamber cells are PC12 cells. (B) TEER values change after the addition of NPs. (C) Photothermal imaging. NPs drug was injected through tail vein and photothermal imaging was obtained by NIR irradiation. (D) Changes of head temperature in mice with NIR irradiation time. (E) Changes in TEER values before and after NPs treatment. (F) WB images of mouse brain tissue treated with different nanoparticles. (1) WT. (2) AD. (3) AD + PRM‐siRNA. (4) AD + PRM‐siRNA + NIR. Fluorescence distribution of (G) PRM‐siRNA and (H) PRM‐siRNA + NIR in mice. All experiments were done at least three times.
FIGURE 6
FIGURE 6
PRM‐siRNA alleviated neural loss, neurofibrillary tangles and activation of astrocytes and microglial cells in APP/PS1 mice. (A) PRM‐siRNA inhibited APP/PS1 mice activation of astrocytes and microglial cells. GFAP and IBA‐1 staining was conducted in mice brain tissue. (B) Nissl staining. (C) Silver staining for neurofibrillary tangles. (D) NeuN‐DAPI staining for neural death. (E) BACE1 expression in APP/PS1 mice. (F) P‐Tau immunofluorescence staining. All experiments were at least done three times.
FIGURE 7
FIGURE 7
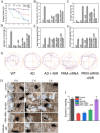
PRM‐siRNA improved the learning and memory of APP/PS1 mice. MWM (Morris water maze) experiment. (A) The APP/PS1 mice of different groups found the change in the escape latency of the hidden platform during the five‐day training period. (B) In the test period without a hidden platform, the effect of nanomaterials on the percentage of APP/PS1 mice target quadrant occupancy. (C) The effect of nanomaterials on the escape latency of APP/PS1 mice during the test period without a hidden platform. (D) During the test period without a hidden platform, the effect of nanomaterials on the number of times APP/PS1 mice cross the target platform. (E) During the training period, the effect of nanomaterials on the average swimming speed of APP/PS1 mice. (F) During the test period, the effect of nanomaterials on the average swimming speed of APP/PS1 mice. Each value represents the mean standard deviation (n = 3). (G) Changes in the path of mice during the test period after removing the hidden platform. On the 6th day, a spatial probe test was carried out. The path of the mouse in the water maze was recorded in 60 s. (H) and (I) The nesting behavior of AD mice was quantified, and WT mice of the same age were used as controls. Representative images from 0 to 3 days. The data are presented as mean S.E. **< 0.01.
FIGURE 8
FIGURE 8
Differentially expressed genes analyzed in mouse brain tissue (AD mice vs. NPs treated AD mice, normal mice control). (A) The Venn diagram shows the overlap of differentially expressed genes obtained from sequencing genes after AD and NPs treatment. (B) Cluster analysis of differentially expressed genes. The red cluster indicates up‐regulated; the blue cluster indicates down‐regulated. (C) Scatter plot of Pearson correlation coefficient between NPs and AD groups. (D) Volcano plot of differentially expressed genes between NPs and AD groups. (E) Scatter plot of Pearson correlation coefficient between NPs and control groups. (F) Volcano plot of differentially expressed genes between NPs and control groups. (G) Statistical enrichment of differential expression genes in GO terms. (H) Statistical enrichment of differential expression genes in KEGG pathway.

References

    1. Ali F. E., Separovic F., Barrow C. J., Yao S., and Barnham K. J., “Copper and Zinc Mediated Oligomerisation of Aβ Peptides,” International Journal of Peptide Research and Therapeutics 12 (2006): 153–164.
    1. Behbehani G. R., “A Novel Method for Thermodynamic Study on Binding of Copper Ion With Alzheimer's Amyliod β Peptide,” Chinese Science Bulletin 54 (2009): 1037–1042.
    1. Behbehani G. R., Barzegar L., Mohebbian M., and Saboury A. A., “A Comparative Interaction Between Copper Ions With Alzheimer′s β Amyloid Peptide and Human Serum Albumin,” Bioinorganic Chemistry and Applications 2012 (2012): 208641. - PMC - PubMed
    1. Epa V. C., Streltsov V. A., and Varghese J. N., “Modelling Copper Binding to the Amyloid‐β Peptide in Alzheimer,” Australian Journal of Chemistry 63 (2010): 345–349.
    1. Isaev N. K., Stelmashook E. V., and Genrikhs E. E., “Role of Zinc and Copper Ions in the Pathogenetic Mechanisms of Traumatic Brain Injury and Alzheimer's Disease,” Reviews Neuroscience 31 (2020): 233–243. - PubMed

LinkOut - more resources