. 2025 Aug 21:12:1873-1892.
doi: 10.2147/JHC.S546808. eCollection 2025.

ZBED4: A Prognostic Biomarker and Therapeutic Target in Hepatocellular Carcinoma

Affiliations

ZBED4: A Prognostic Biomarker and Therapeutic Target in Hepatocellular Carcinoma

Jing Ding et al. J Hepatocell Carcinoma. .

Abstract

Background: Hepatocellular carcinoma (HCC) is a prevalent lethal cancer that remains challenging to treat. Therefore, investigation of novel targets and therapeutic strategies is essential. The role of ZBED4 in cancer remains unclear.

Methods: Data were sourced from The Cancer Genome Atlas (TCGA), Gene Expression Omnibus (GEO), International Cancer Genome Consortium (ICGC), and Genomics of Drug Sensitivity in Cancer (GDSC) databases. Various web platforms and R software, have been utilized. Multiplex immunofluorescence was performed on a human HCC tissue microarray.

Results: High ZBED4 expression correlates with poor prognosis and immune cell infiltration in multiple cancers. ZBED4 is potentially involved in the regulation of the tumor environment by T cells, with a focus on CD8⁺ T cells. In HCC, tissues with elevated ZBED4 expression exhibit a higher prevalence of Tregs and neutrophils, whereas those with reduced ZBED4 expression show an increased abundance of CD8⁺ T cells, activated CD4⁺ T cells, gamma/delta T cells, and activated natural killer (NK) cells. Elevated ZBED4 expression in HCC patients is associated with a reduced response to immune checkpoint blockade but an improved response to chemotherapy and most targeted therapies. A multi-gene prognostic signature has been developed and confirmed across various HCC cohorts. Multiplex immunofluorescence study demonstrated that ZBED4 was linked to poor prognosis and negatively correlated with CD8⁺ T cell infiltration.

Conclusion: Our research elucidates the role of ZBED4, its strong link to immune infiltration, and its potential as a prognostic and therapeutic biomarker for HCC.

Keywords: ZBED4; hepatocellular carcinoma; immune infiltration; pan-cancer; prognosis; therapy.

Plain language summary

Why was this study done?: Hepatocellular carcinoma (HCC) is a common and aggressive liver cancer with limited treatment options. The ZBED gene family plays roles in cancer progression, but the function of one member, ZBED4, was unknown. This study explored whether ZBED4 could serve as a biomarker to predict patient outcomes or guide therapies for HCC.What did the researchers do?We analyzed data from public cancer databases and patient tissue samples to investigate ZBED4’s role in HCC. We examined: How ZBED4 levels vary in tumors compared to normal tissues.Whether ZBED4 affects immune cells in the tumor environment.Its link to patient survival and response to treatments like chemotherapy and immunotherapy.

What did we find?: High ZBED4 levels were linked to worse survival and advanced cancer stages.Tumors with more ZBED4 had fewer cancer-fighting immune cells (like CD8⁺ T cells) and more immunosuppressive cells (like Tregs).ZBED4 may predict drug sensitivity: patients with high ZBED4 responded better to chemotherapy but poorly to immunotherapy.A 10-gene signature based on ZBED4-related genes helped identify high-risk HCC patients.What do these results mean?ZBED4 could be a useful biomarker to guide treatment decisions in HCC. Targeting ZBED4 might improve outcomes, though further research is needed to confirm this. Future basic and clinical studies should explore whether combining ZBED4-targeted therapies with immune-boosting treatments could enhance their effectiveness.

Key terms explained: Biomarker: A measurable indicator of disease or treatment response.Immunotherapy: Treatments that help the immune system fight cancer.Tumor microenvironment (TME): The surrounding cells and molecules that influence tumor growth.This work opens new avenues of ZBED4 for personalized HCC therapy and highlights its importance in the tumor microenvironment and cancer progression.


Conflict of interest statement

The authors report no conflicts of interest in this work.

Figures
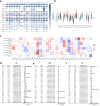
Figure 1
Figure 1
Expression Landscape and Survival Analysis of ZBED Family in Pan-cancer. (a) Heatmap comparing ZBED family gene expression between tumor and adjacent normal tissues across 17 cancer types. (b) Paired sample analysis of ZBED4 expression in 23 cancers and paracancerous samples. (c) A survival map of ZBEDs in the 33 cancers. (d–f) To evaluate the prognosis value of ZBED4, univariate cox regression analysis of the 33 cancers was carried out presented by the forest plots in (d) OS, (e) DSS, and (f) PFI. *p < 0.05, **p < 0.01,***p < 0.001.
Figure 2
Figure 2
Correlation of ZBED4 and Immune-Related Factors in Pan-cancer. (a) CIBERSORT algorithms was applied to explore the correlation between ZBED4 expression and and immune cell infiltration in pan-cancer. (b) The correlation of ZBED4 and immune checkpoints in pan-cancer. (c) The correlation between ZBED4 and TMB in pan-cancer. (d) The correlation between ZBED4 MSI in pan-cancer.
Figure 3
Figure 3
ZBED4 expression in the tumor microenvironment at single-cell levels. ZBED4 expression analysis of different single-cell sequencing datasets from the GEO database including (a) GSE99254 (NSCLC), (b) GSE150766 (SCLC), (c) GSE139555 (CRC), (d) GSE134520 (STAD), (e) GSE111672 (PAAD), (f) GSE125449 (LIHC), (g) GSE140228 (LIHC), (h) GSE98638 (LIHC). Each dashed box presents the t-SNE plot of single-cell clustering, the t-SNE plot of the expression distribution of ZBED4 in different cells, and the bar chart of the expression abundance of ZBED4 in different cells.
Figure 4
Figure 4
Expression Feature, Diagnostic Value and Prognostic Value of ZBED4 in LIHC. (a and b) The different expression of ZBED4 between normal tissues and tumor tissues (a) in cohorts from GSE64041 and (b) in cohorts from GSE62232. (c) The different expression of ZBED4 in patients with high and low pathological TNM-stage from TCGA database. (d) ROC curve analysis for diagnostic value of ZBED4. (e and f) The association of ZBED4, clinicpathological factors and OS by (e) univariate and (f) multivariate cox regression analysis. (g–i) Survival curves between high- and low-ZBED4 groups in (g) OS, (h) DSS, and (i) PFI. **p < 0.01,***p < 0.001,****p < 0.0001.
Figure 5
Figure 5
The Roles of ZBED4 in Immune Cell Infiltration and ICB Response in LIHC. (a and b) The comparison of the gene expression difference of immune profiles by CIBERSORT algorithm between the high- and low-ZBED4 group of LIHC. (c) Heatmap of immune profile gene expression scores stratified by ZBED4 expression levels. (d) A percentage abundance of twenty-two types of tumor-infltrating immune cells. (e) The interacted correlations of ZBED4 and eight immune checkpoint genes in LIHC. (f) The expression distribution of immune checkpoints gene in high- and low ZBED4 expression groups of LIHC. (g) Statistical table of immune response of samples and the distribution of immune response scores in high- and low-ZBED4 expression groups of LIHC. *p < 0.05, **p < 0.01, ***p < 0.001.
Figure 6
Figure 6
Drug Sensitivities Prediction Based on Different ZBED4 Expression Cohorts in LIHC. (a–j) Between the high- and low-ZBED4 expression groups. (a) The IC50 for paclitaxel was compared. (b) The IC50 for gemcitabine was compared. (c) The IC50 for docetaxel was compared; (d) The IC50 for doxorubicin was compared. (e) The IC50 for 5-flurouracil was compared. (f) The IC50 for sorafenib was compared. (g) The IC50 for sunitinib was compared. (h) The IC50 for erlotinib was compared. (i) The IC50 for temsirolimus was compared. (j) The IC50 for foretinib was compared. (k) The correlation between ZBED4 expression and IC50 values for those drugs. ****p < 0.0001.
Figure 7
Figure 7
DEGs Analysis and Functional Enrichment between High- and Low-ZBED4 Groups of LIHC. (a) Volcano plot of DEGs. (b) GO analysis of upregulated DEGs. (c) GO analysis of downregulated DEGs. (d) KEGG analysis of upregulated DEGs. (e) KEGG analysis of downregulated DEGs. (f) GSEA analysis of the GOBP.
Figure 8
Figure 8
Establishment and Validation of Multi-gene Prognostic Signature. (a) LASSO coefficients profiles of 200 DEGs significantly correlated with ZBED4 expression and the prognosis of LIHC patients. (b) LASSO regression with tenfold cross-validation obtained 10 prognostic genes using minimum lambda value. (c) The patients were divided into low- and high-risk group by median risk score. The curve of risk score, the survival status of the patients, and the heatmap of the expression profiles of the ten prognostic genes in the high- and low-risk group were presented. (d) Kaplan–Meier survival analysis of the multi-gene prognostic signature. (e) tROC analysis of the multi-gene prognostic signature. (f) Validation of the multi-gene prognostic signature. An independent LIHC cohort from ICGC dataset (n=240) was regarded as the external validation set. Kaplan-Meier survival analysis of the multi-gene signature in external validation set. (g) tROC analysis of the multi-gene signature in external validation set.
Figure 9
Figure 9
The correlation between ZBED4 protein Expression, CD8⁺T Cell Infiltration and Prognosis in HCC TMA by Multiplex Immunofluorescence. (a) Multiplex immunofluorescence images showed expression features of ZBED4 and CD8 in tumor and paracancerous normal tissues. (b) The comparison of positive rates of ZBED4⁺ cells, CD8⁺T cells, CD8⁺ZBED4- cells, CD8-ZBED4⁺ cells, CD8⁺ZBED4⁺ cells and CD8-ZBED4- cells between tumor and paracancerous normal tissues. (c) The correlation between ZBED4 expression and CD8⁺T cell percent in tumor and paracancerous normal tissues. (d) The comparison of CD8⁺T cell percent between the high-ZBED4 and low-ZBED4 group. (e–h) Survival curves between high and low expression of ZBED4, high and low positive rate of ZBED4⁺ cells, CD8⁺ZBED4- cells, CD8-ZBED4⁺ cells in HCC patients. (i) The association of ZBED4, clinicpathological factors and OS in HCC patients by multivariate Cox regression analysis. (j) Survival curves between high and low positive rate of ZBED4⁺ cells in the HBsAg-positive subgroup. (k) The association of ZBED4, clinicpathological factors and OS in the HBsAg-positive subgroup by multivariate Cox regression analysis. *p < 0.05, ***p < 0.001.

Similar articles

References

    1. Llovet JM, Kelley RK, Villanueva A, et al. Hepatocellular carcinoma. Nat Rev Dis Primers. 2021;7(1):6. doi: 10.1038/s41572-020-00240-3 - DOI - PubMed
    1. Sung H, Ferlay J, Siegel RL, et al. Global cancer statistics 2020: GLOBOCAN estimates of incidence and mortality worldwide for 36 cancers in 185 countries. CA Cancer J Clin. 2021;71(3):209–249. doi: 10.3322/caac.21660 - DOI - PubMed
    1. Llovet JM, De Baere T, Kulik L, et al. Locoregional therapies in the era of molecular and immune treatments for hepatocellular carcinoma. Nat Rev Gastroenterol Hepatol. 2021;18(5):293–313. doi: 10.1038/s41575-020-00395-0 - DOI - PubMed
    1. Greten TF, Lai CW, Li G, Staveley-O’Carroll KF. Targeted and immune-based therapies for hepatocellular carcinoma. Gastroenterology. 2019;156(2):510–524. doi: 10.1053/j.gastro.2018.09.051 - DOI - PMC - PubMed
    1. Zeng CW, Sheu JC, Tsai HJ. Genomic structure, protein character, phylogenic implication, and embryonic expression pattern of a zebrafish new member of zinc finger BED-type gene family. Genes. 2023;14(1):179. doi: 10.3390/genes14010179 - DOI - PMC - PubMed

LinkOut - more resources