Using novel neural measures to explore the development of infant attention bias to threat
- PMID: 40875319
- PMCID: PMC12403228
- DOI: 10.1037/dev0002066
Using novel neural measures to explore the development of infant attention bias to threat
Abstract
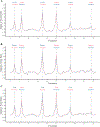
Attention bias to threat is considered an adaptive cognitive phenomenon that is associated with developmental and psychopathological outcomes across the lifespan. However, investigations into the development of attention bias to threat in infancy have produced mixed results. Steady-state visual evoked potentials provide a robust measure of visual cortex processing and attention by capturing brain entrainment to the rhythmic flicker of visual stimuli. This investigation leveraged a novel steady-state visual evoked potential task to examine attention bias to threat via affective expressions and its changes with age within the first 2 years of life. Infants (N = 118, Mage = 9.21 months; rangeage = 3-22 months; 57.61% female) viewed a series of affective face pairs (neutral with happy, fearful, or angry) in which one face flickered at 6 Hz and the other at 7.5 Hz, while their brain activity was measured with electroencephalography. Infants' frequency-tagged brain responses were larger to fearful faces, above all other expressions, consistent with the presence of an attention bias to threat in infancy. Affect-biased attention did not change with age. Furthermore, the presence of an attention bias toward fear was found prior to the literature-suggested age of 7 months. This study demonstrated the utility of using a robust and novel measure of attention, steady-state visual evoked potentials, to examine attention bias to threat and its development during infancy. (PsycInfo Database Record (c) 2025 APA, all rights reserved).
Conflict of interest statement
Figures


Similar articles
-
Prescription of Controlled Substances: Benefits and Risks.2025 Jul 6. In: StatPearls [Internet]. Treasure Island (FL): StatPearls Publishing; 2025 Jan–. 2025 Jul 6. In: StatPearls [Internet]. Treasure Island (FL): StatPearls Publishing; 2025 Jan–. PMID: 30726003 Free Books & Documents.
-
Early developmental intervention programmes provided post hospital discharge to prevent motor and cognitive impairment in preterm infants.Cochrane Database Syst Rev. 2024 Feb 13;2(2):CD005495. doi: 10.1002/14651858.CD005495.pub5. Cochrane Database Syst Rev. 2024. PMID: 38348930 Free PMC article.
-
Exploring Associations Between Infant Attachment, Maternal Sensitivity, and Attention to Maternal Emotion Expressions.Dev Sci. 2025 Sep;28(5):e70057. doi: 10.1111/desc.70057. Dev Sci. 2025. PMID: 40741767 Free PMC article.
-
The stability of early developing attentional bias for faces and fear from 8 to 30 and 60 months in the FinnBrain Birth Cohort Study.Dev Psychol. 2022 Dec;58(12):2264-2274. doi: 10.1037/dev0001432. Epub 2022 Sep 8. Dev Psychol. 2022. PMID: 36074585
-
Education support services for improving school engagement and academic performance of children and adolescents with a chronic health condition.Cochrane Database Syst Rev. 2023 Feb 8;2(2):CD011538. doi: 10.1002/14651858.CD011538.pub2. Cochrane Database Syst Rev. 2023. PMID: 36752365 Free PMC article.
References
-
- Abend R, de Voogd L, Salemink E, Wiers RW, Pérez-Edgar K, Fitzgerald A, White LK, Salum GA, He J, Silverman WK, Pettit JW, Pine DS, & Bar-Haim Y (2018). Association between attention bias to threat and anxiety symptoms in children and adolescents: Depression and anxiety. Depression and Anxiety, 35(3), 229–238. 10.1002/da.22706 - DOI - PMC - PubMed
-
- Adobe. (2024). Photoshop [Computer software].
Grants and funding
LinkOut - more resources
Full Text Sources

