. 2025 Aug 28;135(20):e188559.
doi: 10.1172/JCI188559. eCollection 2025 Oct 15.

A smooth muscle cell lncRNA controls angiogenesis in chronic limb-threatening ischemia through miR-143-3p/HHIP signaling

Affiliations

A smooth muscle cell lncRNA controls angiogenesis in chronic limb-threatening ischemia through miR-143-3p/HHIP signaling

Ming Zhai et al. J Clin Invest. .

Abstract

Peripheral artery disease (PAD) often advances to chronic limb-threatening ischemia (CLTI), resulting in severe complications such as limb amputation. Despite the potential of therapeutic angiogenesis, the mechanisms of cell-cell communication and transcriptional changes driving PAD are not fully understood. Profiling long noncoding RNAs (lncRNAs) from gastrocnemius muscles of participants with or without CLTI revealed that a vascular smooth muscle cell-enriched (SMC-enriched) lncRNA, CARMN, was reduced with CLTI. This study explored how a SMC lncRNA-miRNA signaling axis regulates angiogenesis in limb ischemia. CARMN-KO mice exhibited reduced capillary density and impaired blood flow recovery and tissue necrosis following limb ischemia. We found that CARMN-KO SMC supernatants inhibited endothelial cell (EC) proliferation, spheroid sprouting, and network formation. RNA-seq identified downregulation of the Hedgehog signaling pathway in CARMN-KO models and revealed that CARMN regulates this pathway through its downstream miRNA, miR-143-3p, which targets Hedgehog-interacting protein (HHIP), an antagonist of Hedgehog signaling. Delivery of HHIP-specific siRNA or miR-143-3p mimics rescued EC angiogenic defects and improved blood flow recovery in both CARMN-KO and WT mice. These findings underscore the critical role of CARMN in modulating angiogenesis through the miR-143-3p-HHIP-Hedgehog signaling axis, providing insights into SMC-EC interactions and potential therapeutic strategies for CLTI.

Keywords: Angiogenesis; Cardiovascular disease; Endothelial cells; Noncoding RNAs; Vascular biology.


Figures
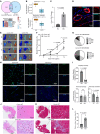
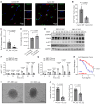
Figure 1
Figure 1. Carmn expression is reduced with limb ischemia and deficiency of Carmn-impaired perfusion recovery after hindlimb ischemia in mice.
(A) (top) Overlap between differentially expressed lncRNAs screened from hypoxia-stimulated SMCs and differentially expressed lncRNAs screened from human gastrocnemius muscles collected from patients with PAD, healthy adults (HA), or patients with CLTI (GSE120642). (bottom) Heatmap of differentially expressed lncRNAs in primary SMCs between normoxia and hypoxia conditions (P = 0.00012). (B) The expression of Carmn in primary SMCs exposed to hypoxia or in gastrocnemius muscles of patients with or without CLTI (P = 1.44 × 10⁻⁸). (C) the relative expression of Carmn in endothelial cells (ECs) and non-ECs. (D) the representative image of Carmn colocalized within the nucleus of α-SMA+ SMCs within the gastrocnemius muscle harvested from Carmn WT mice. (E) Representative Laser Doppler Imaging (LDI) images of hindlimbs immediately after FAL and at different time points. (F) Quantification of blood flow (surgical / contralateral limb) by LDI images, normalized to the nonsurgery limb between 2 groups, (n = 6). (G, Necrosis score of ischemic foot 2 weeks after FAL. (H) the CD31 immunofluorescence staining in WT and Carmn-KO mice. Scale bar: 20 μm. (I) the quantification of CD31+ capillary density, α-SMA+ arteriole density, and diameter of α-SMA+ arterioles. (J) the representative images of H&E staining of gastrocnemius slides from WT or Carmn-KO mice. Scale bar: 100 μm. (K) representative images of Masson trichrome staining of gastrocnemius harvested from Carmn WT or Carmn-KO mice. Scale bar: 100 μm. (L) the quantification of the fibrosis areas between groups. For all panels, error bars represent SEM. P value was determined by unpaired 2-tailed Student’s t test (B, C, I, and L) or 1-way ANOVA with Bonferroni post test (F).
Figure 2
Figure 2. SMC-derived Carmn expression promotes EC proliferation and angiogenesis.
(A) Representative images of CD31+ and Ki67+ staining between gastrocnemius muscles of WT and CARMN-KO mice. Scale bar = 20 μm. (B) the quantification of Ki67+ and CD31+ cells between groups. (C) the quantification of BrdU incorporation of mECs incubated with WT or KO SMC supernatants. (D) quantification of permeability assay of ECs incubated with WT or SMC supernatants. (E) Representative images of Western blots of the indicated AKT and eNOS proteins in mECs after incubation with WT or KO SMC supernatants. (F and G) quantification of relative expression of the indicated proteins. (H, Ach-mediated arterial vasoreactivity in WT or Carmn-KO mice. (I) representative images of EC spheroids cocultured with WT or KO SMC supernatants (WT SMC’s supernatants and KO SMC’s supernatants added to the mouse ECs); (J) related quantification of spheroid sprout branch length and number; Scale bar: 100 μm. For all panels, error bars represent SEM. P value was determined by unpaired 2-tailed Student’s t test (BD, F, G, and J) or 1-way ANOVA (H).
Figure 3
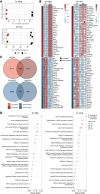
Figure 3. Carmn promotes angiogenic activity by activating the hedgehog signaling pathway.
(A) Scatter plot showing results of a principal component analysis (PCA) of transformed count data from RNA-seq samples. In vitro represents WT or Carmn KO SMCs. In vivo represents WT or Carmn-KO gastrocnemius muscles after 14 days of FAL. (B) Heatmaps of top-30 upregulated (P < 0.01 & log2FC ≥ 0.58) and top-30 downregulated (P < 0.01 & log2FC < –0.58) transcripts. The transcripts are prioritized based on their fold-change values, and the upper and lower panels represent upregulated and downregulated transcripts, respectively. (C) Venn diagrams representing common upregulated and downregulated transcripts for in vitro and in vivo groups. Red and blue colors represent up- and downregulated transcripts. (D) Plot of top-20 significantly enriched pathways (P < 0.05). The triangles pointing up are activated (Z > 0), triangles pointing down are inhibited (Z < 0); circles represent pathways with unknown activation status (Z = 0).
Figure 4
Figure 4. Deficiency of lncRNA CARMN regulates expression of key Hedgehog signaling pathway genes.
(A) Chordplots of in vitro and in vivo significant (P < 0.05) pathways. For each pathway, the top-3 up- or downregulated transcripts (if present) are presented. Blue color–labeled pathways represent inhibited pathways (Z < 0), gray color pathways represent unknown activation status (Z = 0). (B) Box plots of expression level between WT and KO in vitro (top) and in vivo groups (bottom) of well-known representative differentially expressed genes from ‘Sonic Hedgehog Signaling’ pathway. Each boxplot includes the log2FC between the 2 groups.
Figure 5
Figure 5. Carmn regulates Hhip expression in vitro and in vivo.
(A) Left, Normalized counts of Hhip in healthy adults or in patients with intermittent claudication (IC) or CLTI from GEO dataset. (n = 13–16). Right, RT-qPCR results of Hhip expression in gastrocnemius muscle samples in patients with CLTI and non-PAD control group. (B) the relative mRNA expression level between CARMN WT and KO SMCs. (C) representative images of Western blots (WB) of Hhip between CARMN WT and KO SMCs, (D) quantification of WB results in C. (E) ELISA of HHIP concentration in supernatants collected from WT and KO SMC supernatants. (F) the representative images of immunofluorescence for HHIP in gastrocnemius muscles after FAL between Carmn WT and KO mice. Scale bar: 20 μm. (G) The quantification of the mean fluorescence intensity (MFI) of HHIP. (H) the relative expression of Hhip in gastrocnemius harvested from 2 groups of mice that underwent FAL surgery. (I) The relative expression of Hhip in SMC exposed to hypoxia condition after 24 or 48 hours. P value was determined by unpaired 2-tailed Student’s t test (A (right), B, D, E, G, and H) or 1-way ANOVA with Bonferroni post test (A (left) and I).
Figure 6
Figure 6. Hhip targets Hedgehog Signaling Pathway to mediate angiogenic changes in mECs.
(A) Relative mRNA expression levels of Hhip in KO SMCs with siRNA-mediated (si-mediated) knockdown of Hhip or nonspecific control (si-NC) (n = 6). (B) representative images of the WB of HHIP protein from WT or KO SMC with si-NC and si-Hhip transfection. (C) the quantification of HHIP protein expression between Carmn WT or KO SMCs. (D) the HHIP concentration measured by ELISA in supernatants harvested from the indicated groups of SMCs. (E) quantification of BrdU incorporation in mECs incubated with supernatants collected from the indicated groups of SMCs. (F) the representative WB images of specific AKT and eNOS proteins in mECs incubated with supernatants collected from KO SMCs transfected with si-NC or si-Hhip. (G and H) the quantification of relative expression of p-AKT or p-eNOS of mECs incubated with KO SMC si-NC or si-Hhip supernatants. (I) representative WB images of the indicated protein expression of the Hedgehog signaling pathway in Carmn WT or KO SMCs. (J) the quantification of relative expression of proteins in I. (K) representative images of spheroids cocultured with supernatants collected from the indicated 4 groups of SMCs. Scale bar: 100 μm. (L) quantification of branch length and number of sprouts in K. For all panels, error bars represent SEM. P value was determined by unpaired 2-tailed Student’s t test (A, C, G, and H) or 1-way ANOVA with Bonferroni post test (D, E, J, and L).
Figure 7
Figure 7. Inhibition of the Hedgehog signaling pathway in WT SMCs can phenocopy the antiangiogenetic effects of Carmn-KO SMCs.
(A) the representative images of mECs spheroid cocultured with supernatants collected from WT or KO SMCs treated with or without Hedgehog signaling pathway inhibitors. Scale bar: 100 μm. (B) quantification of spheroid branch length and the number of branches in A. (C) the BrdU incorporation of mECs incubated with WT or KO SMCs treated with or without Hedgehog signaling pathway inhibitors. (D) the representative images of WB results of the indicated AKT or eNOS proteins in mECs after being incubated with supernatants collected from WT or KO SMCs treated with or without Hedgehog signaling pathway inhibitors. (E) the quantification of the indicated protein expression levels in D. (F) representative images of mECs in the network formation assay after incubation with supernatants collected from WT or KO SMCs treated with or without Hedgehog signaling pathway inhibitors. Scale bar: 1,000 μm. For all panels, error bars represent SEM. P-value was determined by 1-way ANOVA with Bonferroni post test (B, C, E, and F).
Figure 8
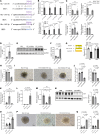
Figure 8. Carmn can inhibit the expression of Hhip through miR-143-3p signaling.
(A) Schematic of binding sites and sequence complentarity for miR143 and miR145 in the Hhip 3′ UTR. (B) the relative expression of miR-143-3p, miR-143-5p, miR-145-3p, and miR-145-5p between Carmn WT and KO SMCs in vivo and in vitro. (C) the relative expression of miR-143-3p, miR-143-5p, miR-145-3p, and miR-145-5p in WT SMC transfected with nonspecific control inhibitor (NSi), miR143 inhibitor, and miR145 inhibitor. (D) the relative expression of Hhip mRNA among WT SMCs transfected with nonspecific control (NSi), miR143 inhibitor, and miR145 inhibitor. (E) the protein expression of HHIP between WT SMCs transfected with nonspecific control (NSi), miR143 inhibitor, and miR145 inhibitor. (F) the quantification of relative expression of HHIP among the 3 groups in E. (G) (Left) Schematic of binding sites between miR-143-3p and Hhip 3′ UTR. (Right) Relative luciferase units (RLU) of WT Hhip 3′ UTR and mutated (MUT) Hhip 3′ UTR luciferase reporter assay with NS mimic or miR-143-3p mimic (n = 6). (H) the BrdU assay of mECs incubated with supernatants collected from WT SMCs transfected with nonspecific control, miR143 inhibitor, and miR145 inhibitor. (I) the representative images of mEC spheroids cocultured with supernatants collected from WT SMCs transfected with nonspecific control (NSi), miR143 inhibitor, and miR145 inhibitor. Scale bar: 100 μm. (J) the quantification of spheroids branch length and the number of branches of spheroids in I. (K and L) the relative expression of miR-143-3p and miR-145-3p between groups of KO SMCs transfected with nonspecific control (NSm), miR-143-3p mimic, or miR-143-5p mimic. (M) the relative expression of Hhip in KO SMCs transfected with nonspecific control (NSm), miR-143-3p mimic, or miR-143-5p mimic. (N) The WB representative images and related quantification of HHIP in KO SMC transfected with nonspecific control, miR-143-3p mimic or miR-143-5p mimic. (O) BrdU incorporation assay of mECs incubated with supernatants collected from KO SMCs transfected with nonspecific control, miR-143-3p mimic, or miR-143-5p mimic. (P) representative images of mEC spheroid cocultured with supernatants collected from KO SMCs transfected with nonspecific control, miR-143-3p mimic, or miR-143-5p mimic. Scale bar: 100 μm. (Q) quantification of spheroid branch length and the number of branches of spheroid in P. For all panels, error bars represent SEM. P value was determined by unpaired 2-tailed Student’s t test (B) or 1-way ANOVA with Bonferroni post test (C, D, FH, JO, and Q).
Figure 9
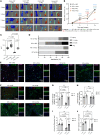
Figure 9. Delivery of siRNA targeting Hhip rescued revascularization in hindlimb ischemia.
(A) Representative Laser Doppler Imaging (LDI) images of Carmn WT or KO hindlimbs at different time points after FAL. The indicated mice received 4 intramuscular injections of si-NC or si-Hhip over 14 days after FAL. (B) Quantification of blood flow (surgical limb/contralateral limb) by LDI images, normalized to the non-FAL limb, (n = 6). (C) quantification of the AUC between the indicated groups of mice. (D) Necrosis score of ischemic foot 2 weeks after FAL. For all panels, error bars represent SEM. (E) Confocal micrographs of gastrocnemius muscle immunostained with isolectin+ (green) and α-SMA (red). DAPI was used as a nuclear counterstain. (F) The immunofluorescence staining of isolectin+ (green) and Ki67 (red) under fluorescent microscope. (G) The quantification of capillary (isolectin+ / Field) density in gastrocnemius muscle in ischemia limb harvested from 4 groups of mice. (H) The quantification of arteriole density (α-SMA+ / Field) density in gastrocnemius muscle in ischemia limb harvested from 4 groups of mice. (I) The quantification of arteriole diameter in gastrocnemius muscle in ischemia limb harvested from 4 groups of mice. (J) the quantification of number of KI67+ isolectin+ endothelial cells in gastrocnemius muscle harvested from the indicated groups of mice. The P value was determined by 1-way ANOVA with Bonferroni post tests (B, C, and GJ).
Figure 10
Figure 10. Delivery of miR-143-3p in vivo rescued revascularization in hindlimb ischemia.
(A) Representative Laser Doppler Imaging (LDI) images of Carmn WT or KO hindlimbs at different time points after FAL. The indicated mice received 4 intramuscular injections of NS control or miR-143-3p mimics over 14 days after FAL. (B) Quantification of blood flow (surgical limb/contralateral limb) by LDI images, normalized to the AUC between the indicated groups of mice. (D) Necrosis score of ischemic foot 2 weeks after FAL. (E) representative IF images of gastrocnemius muscle immunostained with isolectin (green) and α-SMA (red). DAPI was used as a nuclear counterstain. (F) the quantification of capillary (isolectin+ / Field) density in gastrocnemius muscle in ischemia limb harvested from 4 groups of mice. (G) the quantification of arteriole density (α-SMA+ / Field) density in gastrocnemius muscle in ischemia limb harvested from 4 groups of mice. (H) the quantification of arteriole diameter in gastrocnemius muscle in ischemia limb harvested from 4 groups of mice. (I) the immunofluorescence staining of isolectin (green) and Ki67 (red) under fluorescent microscope. (J) the quantification of number of KI67+ isolectin+ endothelial cells in gastrocnemius muscle harvested from the indicated groups of mice. For all panels, error bars represent SEM. The P value was determined by 1-way ANOVA with Bonferroni post tests (B, C, F, G, H, and J).

Comment in

  • CARMN orchestrates angiogenesis from behind the opera scenes: signing love letters to the endothelium doi: 10.1172/JCI197708

References

    1. Hussain MA, et al. Antithrombotic therapy for peripheral artery disease: recent advances. J Am Coll Cardiol. 2018;71(21):2450–2467. doi: 10.1016/j.jacc.2018.03.483. - DOI - PubMed
    1. Usman R, et al. Clinical efficacy of infra popliteal angioplasty for below the knee peripheral vascular occlusive disease. J Ayub Med Coll Abbottabad. 2023;35(4):553–557. doi: 10.55519/JAMC-04-12057. - DOI - PubMed
    1. Farber A, et al. Surgery or endovascular therapy for chronic limb-threatening ischemia. N Engl J Med. 2022;387(25):2305–2316. doi: 10.1056/NEJMoa2207899. - DOI - PubMed
    1. Eelen G, et al. Basic and therapeutic aspects of angiogenesis updated. Circ Res. 2020;127(2):310–329. doi: 10.1161/CIRCRESAHA.120.316851. - DOI - PubMed
    1. Annex BH, Cooke JP. New directions in therapeutic angiogenesis and arteriogenesis in peripheral arterial disease. Circ Res. 2021;128(12):1944–1957. doi: 10.1161/CIRCRESAHA.121.318266. - DOI - PMC - PubMed

MeSH terms