. 2025 Aug 28;23(8):e3003302.
doi: 10.1371/journal.pbio.3003302. eCollection 2025 Aug.

Defining cellular diversity at the swine maternal-fetal interface using spatial transcriptomics and organoids

Affiliations

Defining cellular diversity at the swine maternal-fetal interface using spatial transcriptomics and organoids

Cole R McCutcheon et al. PLoS Biol. .

Abstract

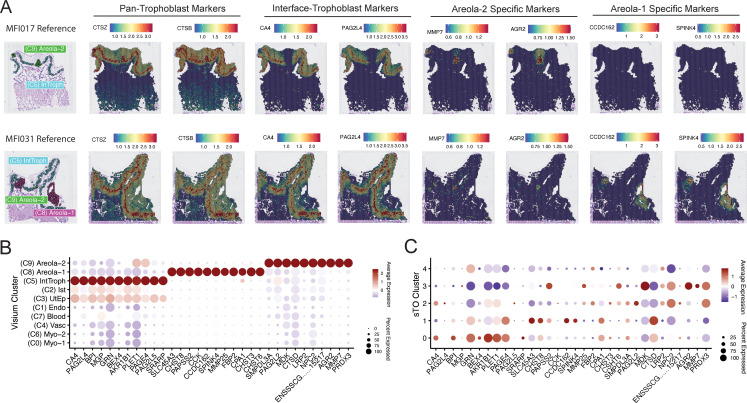
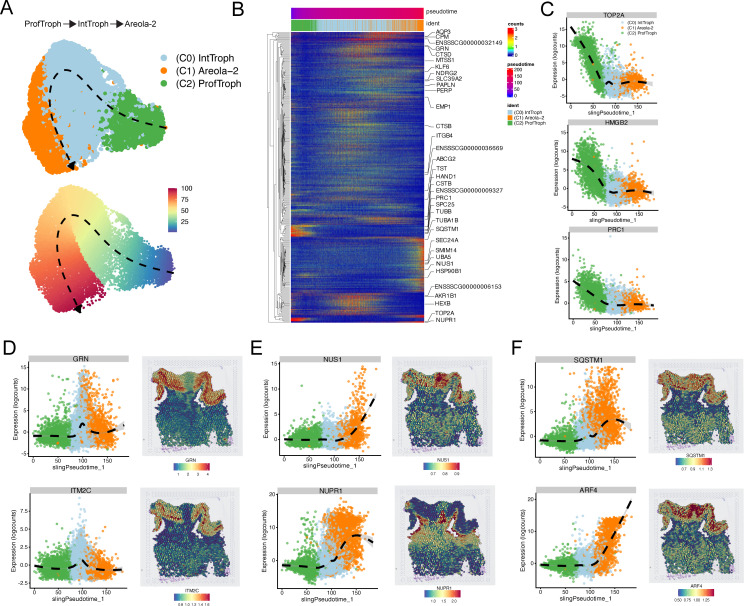
The placenta is a dynamic, embryo-derived organ essential for fetal growth and development. While all eutherian mammals have placentas composed of fetal-derived trophoblasts that mediate maternal-fetal exchange, their anatomical and histological structures vary across species due to evolutionary divergence. Despite the cellular heterogeneity of porcine trophoblasts in vivo, understanding the mechanisms driving porcine placental development has been limited by the lack of in vitro models replicating this heterogeneity. In this study, we derived swine trophoblast organoids (sTOs) from full-term porcine placentas, retaining key transcriptional signatures of in vivo trophoblasts. To identify conserved cell populations, we integrated Visium spatial transcriptomics from mid-gestation porcine placentas with single-cell transcriptomics from sTOs. Spatial transcriptomics revealed novel markers of the porcine uterus and placenta, enabling precise separation of histological structures at the maternal-fetal interface. The integration of tissue and sTO transcriptomics showed that sTOs spontaneously differentiate into distinct trophoblast populations, with conserved gene expression and cell communication programs. These findings demonstrate that sTOs recapitulate porcine placental trophoblast populations, offering a powerful model for advancing placentation research. Our work also provides a spatially resolved whole-transcriptome dataset of the porcine maternal-fetal interface, opening new avenues for discoveries in placental development, evolution, and health across mammals.


Conflict of interest statement

The authors have declared that no competing interests exist.

Figures

Fig 1
Fig 1. Establishment and validation of swine trophoblast organoids (sTO).
A) Schematic of sTO derivation workflow. Created in BioRender. McCutcheon, C. (2025) https://BioRender.com/ohwh6rx. B) Representative low magnification brightfield image from a single well of sTO. C) High magnification brightfield image of sTO grown in Matrigel. D) Representative Hematoxylin and Eosin staining of a sectioned sTOs. E, F) Immunofluorescence microscopy image of sTO grown in Matrigel stained with E) mKi67 and F) cytokeratin 18. G) Immunofluorescence microscopy image of sTO grown in Matrigel “domes”. Apical marker ZO-1 is in green, DAPI in gray, and Actin in red. H) Immunofluorescence microscopy image of sTOs grown in suspension for 48 hours. Apical marker ZO-1 is in green, DAPI in gray, and Actin in red. I) Representative brightfield image of sTO grown in Matrigel “dome” (right) and suspension (left). J) Bar-plot showing the average summation of RPKM for nine Y-linked genes across 3 individual sTO lines. Black dots indicate replicates. sTO lines are denoted on the x-axis. K) Heatmap of known pig placentae and uterus markers expressed across Uterus, PTr2 cells, sTOs, and term pig placentae. Individual columns indicate replicates. Clustering of columns is performed using hierarchical clustering, which groups columns with similar expressional patterns. The underlying data for this figure can be found at the Gene Expression Omnibus via accession numbers GSM8980984, GSM8980985, GSM8980986, GSM8980987, GSM8980988, GSM8980989, GSM8980990, GSM8980991, GSM9083242, and GSM9083243.
Fig 2
Fig 2. Single-cell transcriptomics of sTOs reveals cellular heterogeneity.
A) UMAP from single-cell transcriptomics of 3 independent lines of sTOs. B) Stacked bar-plot showing the relative proportions of various cell populations across three sTO lines. C) Violin plot showing the expression of canonical trophoblast markers in sTO single-cell data. D) Violin plot showing the expression of canonical fibroblast markers in sTO single-cell data. E) Dot-plot showing the top enrichment markers for various cell populations in sTOs. Color of dots denotes average expression, whereas size represents percentage of cells in a cluster expressing the gene of interest. F) Dot-plot of canonical markers of various porcine trophoblast populations. Color of dots denotes average expression, whereas size represents percentage of cells in a cluster expressing the gene of interest. G) Feature plot showing widespread expression of pan-trophoblast markers in sTOs. The underlying data for this figure can be found at the Gene Expression Omnibus via accession numbers GSM8980992, GSM8980993, and GSM8980994.
Fig 3
Fig 3. Spatial transcriptomics resolves global expression at the porcine maternal–fetal interface.
A) Schematic of spatial transcriptomics workflow of gestational day 66 (GD66) maternal–fetal interfaces (n = 4; 2 male and 2 female). Created in BioRender. Mccutcheon, C. (2025) https://BioRender.com/hus6ktj B) UMAP showing 10 distinct populations obtained via spatial transcriptomics. C) Dot-plot of top markers for each cluster obtained via spatial transcriptomics. Color of dots denotes average expression, whereas size represents percentage of cells in a cluster expressing the gene of interest. D) H&E staining of individual porcine maternal–fetal interface sections (top). Spatial Dim-Plot showing the histologic localization of UMAP cluster populations (bottom). Each image represents a separate maternal–fetal interface. E) Spatial Dim-Plot showing separation of maternal and fetal compartments. Representative maternal–fetal Interface shown. F) Spatial Dim-Plot showing the histologic localization of UMAP individual cluster populations. Representative maternal–fetal Interface shown (MFI094). G) Stacked bar-plot showing the relative proportion of each cluster across individual maternal–fetal interfaces. H) Spatial Dim-Plot (Left panels) and Spatial Feature plots (Right panels) showing the localization of areola-1 and areola-2 structures (Left panels) and the expression of CTSL (right panels) within representative maternal–fetal interfaces. The underlying data for this figure can be found at the Gene Expression Omnibus via accession numbers GSM8980980, GSM8980981, GSM8980982, and GSM8980983.
Fig 4
Fig 4. Spatial transcriptomics identifies novel trophoblast specific markers.
A) Spatial Feature Plots showing the localization of known or novel pan-trophoblast markers, interface-trophoblast markers, areola-2 and areola-1 specific markers. Two representative maternal–fetal interfaces are shown. The reference localization of these structures are shown on the far-left panels. B) Dot Plot showing expanded markers of various trophoblast populations within the maternal–fetal interface. Color of dots denotes average expression, whereas size represents percentage of cells in a cluster expressing the gene of interest. C) Dot Plot showing the cluster-specific expression of known and novel trophoblast markers from (B) in sTOs. Color of dots denotes average expression, whereas size represents percentage of cells in a cluster expressing the gene of interest. The underlying data for this figure can be found at the Gene Expression Omnibus via accession numbers GSM8980980, GSM8980981, GSM8980982, and GSM8980983.
Fig 5
Fig 5. Cell–cell interactions within the porcine placenta maternal–fetal interface.
A) Chord diagrams showing the number (Left panel) and strength (right panel) of calculated inter-cluster interactions within the porcine maternal–fetal interface. B) Heatmap showing the number (left panel) and strength (right panel) of interactions between clusters within the porcine maternal–fetal interface. Color indicates increased number (left) or strength (right) between the sending cluster and the receiving cluster. C) Heatmaps showing the outgoing (upper left panel) and Incoming (upper right panel) signaling patterns by cluster for Visium spatial transcriptomics. Coloring indicates relative cluster contribution to a pattern with red being high and blue being low contribution level. Lower panels similarly indicate the contribution a specific signaling pathway to the corresponding pattern designation with the lower right panel indicating outgoing signaling patterns and the lower left panel indicating incoming signaling patterns. D, E) Plots showing HSPG signaling within the porcine maternal–fetal interface, with D) being a chord diagram and E) showing the spatial localization of these interactions. F) Spatial feature plot showing the localization of various genes associated with the HSPG pathway. The right panel shows the localization of HSPG2, whereas the left panel shows the localization of DAG1. G, H) Plots showing MK signaling within the porcine maternal–fetal interface, with G) being a chord diagram and H) showing the spatial localization of these interactions. I) Spatial feature plot showing the localization of various genes associated with the MK pathway. The right panel shows the localization of MDK, whereas the left panel shows the localization of SDC2. J, K) Plots showing IL6 signaling within the porcine maternal–fetal interface, with J) being a chord diagram and K) showing the spatial localization of these interactions. L) Spatial feature plot showing the localization of various genes associated with the IL6 pathway. The right panel shows the localization of IL6, whereas the left panel shows the localization of IL6R. The underlying data for this figure can be found at the Gene Expression Omnibus via accession numbers GSM8980980, GSM8980981, GSM8980982, and GSM8980983.
Fig 6
Fig 6. Integration of sTOs and spatial transcriptomics datasets enables precise cellular identification and classification.
A) Spatial Dim-Plot showing facetted clusters from two representative maternal–fetal interfaces. As shown Areola-1, Areola-2, and Interface-Trophoblasts were included in this analysis. B) UMAP of sTOs clusters obtained via single-cell RNA-sequencing (n = 3 lines). C) Stacked bar-plot showing relative proportions of various clusters across individual maternal–fetal interfaces. D, E) Spatial feature plot showing prediction scores for each spot in the spatial dataset subsetted by sTO cluster. Color shown indicates probability that the classified sTO cluster is localized to a given position within the spatial dataset. F, G) Dot-plot showing the localization of shared markers between the sTO clusters (F) and maternal–fetal interface clusters (G) Color of dots denotes average expression, whereas size represents percentage of cells in a cluster expressing the gene of interest. H) Stacked Bar Plot showing the relative proportion and identity of sTO cell populations. The underlying data for this figure can be found at the Gene Expression Omnibus via accession numbers GSM8980980, GSM8980981, GSM8980982, GSM8980983, GSM8980992, GSM8980993, GSM8980994.
Fig 7
Fig 7. Trajectory analysis reveals the differentiation pathway of swine trophoblasts.
A) UMAPs showing Slingshot calculated trajectory of trophoblasts within sTO. Top panel shows the trajectory across labeled clusters, whereas bottom panel shows the trajectory across a pseudotime. B) Heatmap showing temporally regulated genes across the calculated pseudotime trajectory. Individual columns represent individual cells that are ordered along the calculated pseudotime. Identities are positions along the pseudotime are shown above the heatmap. C) Representative expression plots showing gene expression changes along the calculated pseudotime that are enriched in the proliferative stem cell population. D) Representative expression plots and spatial feature plots showing genes that are enriched during the transition to Interface-Trophoblasts and their expression pattern within our spatial transcriptomics dataset. E, F) Representative expression plots and spatial feature plots showing genes that are enriched during the transition to Areola-2 trophoblasts and their expression pattern within our spatial transcriptomics dataset. The underlying data for this figure can be found at the Gene Expression Omnibus via accession numbers GSM8980980, GSM8980981, GSM8980982, GSM8980983, GSM8980992, GSM8980993, GSM8980994.
Fig 8
Fig 8. sTOs recapitulate the trophoblast crosstalk pathways observed in the porcine placenta.
A) Venn Diagram showing the number of unique and shared trophoblast communication pathways between sTO and porcine trophoblasts in vivo. B) Heatmaps showing the number (top left panel) and strength (top right panel) of interactions between clusters within sTO. Similarly, the bottom panels show the number (bottom left panel) and strength (bottom right panel) of interactions within porcine trophoblasts from spatial transcriptomics data. In both cases Color indicates increased number (left) or strength (right) between the sending cluster and the receiving cluster. C–F) Heatmaps showing the signaling patterns (top panels) and the shared signaling pathways contributing to those patterns, for sTO and porcine trophoblasts from spatial transcriptomics. C, D) shows the outgoing patterns for C) porcine trophoblasts obtained via spatial transcriptomics and D) sTO. E, F) shows the incoming patterns for E) porcine trophoblasts obtained via spatial transcriptomics and F) sTO. For upper panels, coloring indicates relative cluster contribution to a pattern with red being high and blue being low contribution level. For lower panels, color indicates the relative contribution of a pathway to a given pattern. G, H) Chord diagrams showing ANGPTL signaling within both G) Visium trophoblasts and H) sTO. I, J) Dot plots showing the expression level of pathways within the ANGPTL pathway for I) Visium trophoblasts and J) sTO. Color of dots denotes average expression, whereas size represents percentage of cells in a cluster expressing the gene of interest. K, L) Chord diagrams showing CDH signaling within both K) Visium trophoblasts and L) sTO. M, N) Dot plots showing the expression level of pathways within the CDH pathway for M) Visium trophoblasts and N) sTO. Color of dots denotes average expression, whereas size represents percentage of cells in a cluster expressing the gene of interest. O, P) Chord diagrams showing AGRN signaling within both O) Visium trophoblasts and P) sTO. Q, R) Dot plots showing the expression level of pathways within the AGRN pathway for Q) Visium trophoblasts and R) sTO. Color of dots denotes average expression, whereas size represents percentage of cells in a cluster expressing the gene of interest. The underlying data for this figure can be found at the Gene Expression Omnibus via accession numbers GSM8980980, GSM8980981, GSM8980982, GSM8980983, GSM8980992, GSM8980993, GSM8980994.

Comment in

References

    1. Hay WW Jr. Placental transport of nutrients to the fetus. Horm Res. 1994;42(4–5):215–22. doi: 10.1159/000184196 - DOI - PubMed
    1. Lager S, Powell TL. Regulation of nutrient transport across the placenta. J Pregnancy. 2012;2012:179827. doi: 10.1155/2012/179827 - DOI - PMC - PubMed
    1. Tal R, Taylor HS. Endocrinology of pregnancy. In: Feingold KR, Anawalt B, Blackman MR, Boyce A, Chrousos G, Corpas E, et al., editors. Endotext. 2000. - PubMed
    1. Arora N, Sadovsky Y, Dermody TS, Coyne CB. Microbial vertical transmission during human pregnancy. Cell Host Microbe. 2017;21(5):561–7. doi: 10.1016/j.chom.2017.04.007 - DOI - PMC - PubMed
    1. Megli CJ, Coyne CB. Infections at the maternal-fetal interface: an overview of pathogenesis and defence. Nat Rev Microbiol. 2022;20(2):67–82. doi: 10.1038/s41579-021-00610-y - DOI - PMC - PubMed

LinkOut - more resources