. 2025 Aug 28;23(8):e3003349.
doi: 10.1371/journal.pbio.3003349. eCollection 2025 Aug.

Alterations in ether lipid metabolism in obesity revealed by systems genomics of multi-omics datasets

Affiliations

Alterations in ether lipid metabolism in obesity revealed by systems genomics of multi-omics datasets

Yvette L Schooneveldt et al. PLoS Biol. .

Abstract

Ratios between two metabolites are sensitive indicators of metabolic changes. Lipidomic profiling studies have revealed that plasma ether lipids, a class of glycero- and glycerophospho-lipids with reported health benefits, are negatively associated with obesity. Here, we utilized lipid ratios as surrogate markers of lipid metabolism to explore the processes underlying the inverse relationship between ether lipid metabolism and obesity. Plasma lipidomics data from two independent human cohorts (n = 10,339 and n = 4,492) were integrated to assess the associations between 82 lipid ratios and obesity-related markers in males and females. Results were externally validated using mouse transcriptomics data from the Hybrid Mouse Diversity Panel (n = 152-227 across 74 strains). Genome-wide association studies using imputed genotypes from a population cohort (n = 4,492) were performed to examine the genetic architecture of the ratios. Findings showed that waist circumference (WC), body mass index, and waist-hip ratio were inversely associated with total plasmalogens relative to total phospholipids in both sexes. Ratios comprising product-substrate pairs positioned either side of enzymes involved in plasmalogen synthesis and degradation showed positive and negative associations with WC, respectively. Branched-chain fatty acids negatively correlated with WC, while omega-6 polyunsaturated fatty acids exhibited differing associations depending on their position within the pathway. Mouse transcriptomics corroborated these results. Genomics data showed strong associations between ratios containing choline-plasmalogens and single-nucleotide polymorphisms in the transmembrane protein 229B (TMEM229B) gene region. This work demonstrates the utility of lipid ratios in understanding lipid metabolism. By applying the ratios to multi-omic datasets, we identified alterations in enzymatic activity and genetic variants likely affecting ether lipid synthesis in obesity that could not have been obtained from lipidomics data alone. Additionally, we characterized a potential role for TMEM229B, offering new perspectives on ether lipid metabolism and regulation.


Conflict of interest statement

I have read the journal's policy and the authors of this manuscript have the following competing interests: The Baker Heart and Diabetes Institute holds a patent (PCT/AU2020/050742, titled “Composition and Methods of Use”) describing modulation of plasmalogens to improve metabolic health, with PJM listed as the Inventor. This patent has been licensed to Juvenescence Ltd, and a family of related patents have since been filed.

Figures

Fig 1
Fig 1. Validation of lipid ratios across markers of obesity.
Correlation between the regression coefficients of each lipid ratio in the AusDiab cohort (n = 10,399); A) waist circumference (x axis) and body-mass-index (y axis) and B) waist circumference (x axis) and waist–hip ratio (y axis). Lipid ratios were log2 transformed, mean-centered, and scaled to standard deviation (SD). WC, waist circumference; BMI, body-mass index; WHR, waist–hip ratio; SD-Change, standard deviation-change.
Fig 2
Fig 2. Sex-specific associations between 82 lipid ratios and waist circumference.
Linear regression analysis, including sex as the interaction term and adjusting for age, was performed between 82 lipid ratios and waist circumference (WC) in the AusDiab cohort (n = 10,399). Hollow points (green circles = male; pink diamonds = female) depict ratios with significantly different associations with WC between males and females (interaction p-value <0.05). Ratios with significant p-gains (p-gain >820) are overlayed in coloured points (green circles = male; pink diamonds = female). Lipid ratios were log2 transformed, mean-centered and scaled to standard deviation. p-values were corrected for multiple comparisons using the false discovery rate method of Benjamini and Hochberg. p-gains were calculated separately for males and females by dividing the lower p-value of the two lipid classes in the ratio by the p-value of the lipid ratio. SD-Change per unit WC: standard deviation-change per unit of WC; PEDS1: plasmanylethanolamine desaturase; iPLA2: calcium-independent phospholipase A2; LPAT: lyso-phospholipid acyltransferase; PEMT: phosphatidylethanolamine N-methyltransferase; PLC: phospholipase C; CPT: choline phosphotransferase; omega-3: omega-3 poly-unsaturated pathway; omega-6: omega-6 poly-unsaturated pathway; DNL: de novo lipogenesis pathway; PE: phosphatidylethanolamine; PE(O): alkyl-phosphatidylethanolamine; PE(P): alkenyl-phosphatidylethanolamine; LPE: lyso-phosphatidylethanolamine; LPE(P): lyso-alkenyl-phosphatidylethanolamine; PC: phosphatidylcholine; PC(O): alkyl-phosphatidylcholine; PC(P): alkenyl-phosphatidylcholine; LPC: lyso-phosphatidylcholine; LPC(O): lyso-alkyl-phosphatidylcholine; LPC(P): lyso-alkenyl-phosphatidylcholine; 16:0 sn-1: chimyl alcohol; 18:0 sn-1: batyl alcohol; 16:0 sn-2: palmitic acid; 18:0 sn-2: steric acid; 18:1 sn-2: oleic acid; 18:2 sn-2: linoleic acid; 20:4 sn-2: arachidonic acid; 20:5 sn-2: eicosapentaenoic acid; 22:4 sn-2: adrenic acid; 22:5 sn-2: docosapentaenoic acid; 22:6 sn-2: docosahexaenoic acid; sn-1: fatty alkenyl- or acyl-chain located in the sn-1 position; sn-2, fatty acyl-chain located in the sn-2 position.
Fig 3
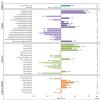
Fig 3. Lipid set enrichment analysis of waist circumference with 735 lipid species.
Lipidomic analysis was performed on the AusDiab cohort (n = 10,399). Enrichment scores were calculated by summing the association t-statistics for individual lipids against waist circumference. Annotations depict corrected p-values. Lipid categories denote a pre-defined lipid set used in the analysis; subclasses are clustered by unique structural features; classes map to lipid species containing the relevant headgroup; features include lipid species containing the respective fatty acid at the sn-1, sn-2 or sn-3 position; features (PUFA) map to lipid species containing either an omega-3 or omega-6 fatty acid at the sn-1, sn-2 or sn-3 position; no. lipids details the number of individual lipid species within each lipid set. Lipidomics data was log2 transformed and p-values were corrected for multiple comparisons using the false discovery rate method of Benjamini and Hochberg; *p < 0.05, **p < 0.01, ***p < 0.001, ****p < 0.0001.
Fig 4
Fig 4. Effect of a high-fat/high-sugar diet on genes involved in ether lipid and fatty acid metabolism.
Liver microarray data of male mice across 74 matched strains (n = 2–3 per strain) after either a high-fat/high-sugar (navy, n = 152) or chow (blue, n = 222) diet for eight weeks. Plots depict consolidated micro-array data across each strain. Data was log2 transformed and analyzed using Mann–Whitney U tests. Gnpat: glyceronephosphate-O-acyltransferase; Gpd1: glycerol-3-phosphate dehydrogenase 1; Far1: fatty-acid reductase 1; Tmem189: transmembrane protein 189; Pemt: phosphatidylethanolamine N-methyltransferase; Pex14: peroxisomal biogenesis factor 14; Pex16: peroxisomal biogenesis factor 16; Pex19: peroxisomal biogenesis factor 19; Lpcat3: lyso-phosphatidylcholine acyltransferase 3; Pla2g6: phospholipase A2 group VI; Acox1: acyl-coa oxidase 1; Gpx4: glutathione peroxidase 4; Fasn: fatty acid synthase; Acaca: acetyl-Coa carboxylase; Fads1: fatty acid desaturase 1; Fads2: fatty acid desaturase 2; Elovl2: fatty-acid elongase 2; Elovl5: fatty-acid elongase 5. Data is publicly accessible from Gene Expression Omnibus under the accession codes: GSE16780, GSE64769; *p < 0.05, **p < 0.01, ***p < 0.001, ****p < 0.0001.
Fig 5
Fig 5. Sex-specific effects of a high-fat/high-sugar diet on genes involved in ether lipid and fatty acid metabolism.
Liver microarray data of male (navy, n = 227) and female (purple, n = 206) mice across 108 strains (n = 2-3 per strain) after a high-fat/high-sugar diet for eight weeks. Plots depict consolidated micro-array data across each strain. Data was log2 transformed and analyzed using Mann–Whitney U tests. Gnpat, glyceronephosphate-O-acyltransferase; Gpd1: glycerol-3-phosphate dehydrogenase 1; Far1: fatty-acid reductase 1; Tmem189: transmembrane protein 189; Pemt: phosphatidylethanolamine N-methyltransferase; Pex14: peroxisomal biogenesis factor 14; Pex16: peroxisomal biogenesis factor 16; Pex19: peroxisomal biogenesis factor 19; Lpcat3: lyso-phosphatidylcholine acyltransferase 3; Pla2g6: phospholipase A2 group VI; Acox1: acyl-coa oxidase 1; Gpx4: glutathione peroxidase 4; Fasn: fatty acid synthase; Acaca: acetyl-Coa carboxylase; Fads1: fatty acid desaturase 1; Fads2: fatty acid desaturase 2; Elovl2: fatty-acid elongase 2; Elovl5: fatty-acid elongase 5. Data is publicly accessible from Gene Expression Omnibus under the accession code: GSE64769; *p < 0.05, **p < 0.01, ***p < 0.001, ****p < 0.0001.
Fig 6
Fig 6. Genome-wide association study on 82 lipid ratios.
Genome-wide association analysis (GWAS) was performed on lipid ratios using imputed genotype data from the BHS cohort (n = 4,492; 13,887,524 single-nucleotide polymorphisms). Manhattan plots depict loci that associate with the lipid ratio. X-axis shows chromosomal positions, Y-axis shows −log10 p-values, and gray dotted lines indicate the genome-wide significant threshold (p-value < 5 × 10⁻⁸). ALDH1A2: aldehyde dehydrogenase 1 family member A2; LIPC: hepatic lipase C; SIDT2: the systemic RNAi-defective transmembrane family member 2; APOC3: apolipoprotein C-III; PAFAH1B1: platelet activating factor acetylhydrolase 1b; CEB164: centrosomal protein; FADS1:fatty acid desaturase 1; FADS2: fatty acid desaturase 2; FADS3: fatty acid desaturase 3; TMEM229B: transmembrane protein 229B; PEDS1: plasmanylethanolamine desaturase 1; CLEC16A: C-type lectin domain family 16; TMEM86B: transmembrane protein 86B; ARMH4: Armadillo like helical domain containing 4.
Fig 7
Fig 7. Connecting genomic variations to lipid metabolism.
A) Regional association plot of genetic variants against the PC(O)/PC(P) ratio for the transmembrane protein 229B (TMEM229B) locus. The single-nucleotide polymorphism (SNP) showing the smallest p-value is depicted as a purple diamond and labeled. Other SNPs are color-coded according to the extent of linkage disequilibrium (r2); B) Micro-array data on the Tmem229b gene in male mice across 108 strains (n = 2–3 per strain) on a high-fat/high-sugar (navy, n = 226) or chow (blue, n = 254) diet for eight weeks. Microarray data is publicly accessible from Gene Expression Omnibus under the accession code: GSE64769. ****p < 0.0001; C and D) PheWas plots depicting the association between lead variants and lipid species. X-axis: lipid classes, y-axis: −log10 p-values. Each triangle represents an individual lipid species and its orientation depicts the directionality of the association between the lipid species and gene of interest.
Fig 8
Fig 8. Integration of lipid ratios with multi-omic datasets to explore ether lipid metabolism in obesity.
Summary figure details changes in ether lipid metabolism in obesity as indicated by the lipid ratios, liver micro-array data, and GWAS analysis. Coloured text depicts potential changes in enzymatic activity (green: increase; red: decrease), identified through linear regression analysis, adjusting for age and sex, of 82 lipid ratios and waist circumference in the AusDiab cohort (n = 10,399). Lipid ratios were log2 transformed, mean-centered and scaled to standard deviation. p-values were corrected for multiple comparisons using the false discovery rate method of Benjamini and Hochberg. Scatter plots depict consolidated liver micro-array data of male mice across 74 matched strains (n = 2−3 per strain) after either a high-fat/high-sugar (navy, n = 152) or chow (blue, n = 222) diet for eight weeks. Data was log2 transformed and analyzed using Mann–Whitney U tests; ****p < 0.0001. Manhattan plots show associations between the PE(O)/PE(P) and PC(O)/PC(P) ratios and TMEM189 and TMEM229B loci in the BHS cohort (n = 4,492), respectively. Orange text depicts the location of the proposed lyso-plasmalogenase TMEM229b. DHAP: dihydroxyacetone phosphate; Gpd1: glycerol-3-phosphate dehydrogenase 1 (encodes for G3pdh); G3pdh: glycerol-3-phosphate dehydrogenase; DG: diacylglycerol; TG: triacylglycerol; PE: phosphatidylethanolamine; PC: phosphatidylcholine; Gnpat: glyceronephosphate O-acyltransferase; Adhap-S: alkyl-dihydroxyacetone phosphate synthase; Far1: fatty acyl-CoA reductase 1; Far2: fatty acyl-CoA reductase 2; Tmem189: transmembrane protein 189 (encodes for Peds1); Peds1: plasmanylethanolamine-desaturase-1; Plc: phospholipase C; Pemt: phosphatidylethanolamine N-methyltransferase; C-pt: choline phosphotransferase; Pla2g6: phospholipase A2 group VI (encodes for iPla2); iPla2: i-phospholipase A2, calcium independent phospholipase A2; Lpeat3: lyso-phosphatidylethanolamine acyltransferase 3; Lpcat3: lyso-phosphatidylcholine acyltransferase 3; Tmem86b: transmembrane protein 86b; Tmem229B: transmembrane protein 229b; GPC: glycerophosphocholine; GPE: glycerophosphoethanolamine.

References

    1. Harwood JL, Michell RH, Murphy DJ, Gurr MI, Frayn KN. Lipids: biochemistry, biotechnology and health. 6th ed. Chichester, West Sussex: John Wiley & Sons; 2016.
    1. Pietiläinen KH, Sysi-Aho M, Rissanen A, Seppänen-Laakso T, Yki-Järvinen H, Kaprio J, et al. Acquired obesity is associated with changes in the serum lipidomic profile independent of genetic effects—a monozygotic twin study. PLoS One. 2007;2(2):e218. doi: 10.1371/journal.pone.0000218 - DOI - PMC - PubMed
    1. Graessler J, Schwudke D, Schwarz PEH, Herzog R, Shevchenko A, Bornstein SR. Top-down lipidomics reveals ether lipid deficiency in blood plasma of hypertensive patients. PLoS One. 2009;4(7):e6261. doi: 10.1371/journal.pone.0006261 - DOI - PMC - PubMed
    1. Meikle PJ, Wong G, Barlow CK, Weir JM, Greeve MA, MacIntosh GL, et al. Plasma lipid profiling shows similar associations with prediabetes and type 2 diabetes. PLoS One. 2013;8(9):e74341. doi: 10.1371/journal.pone.0074341 - DOI - PMC - PubMed
    1. Puri P, Wiest MM, Cheung O, Mirshahi F, Sargeant C, Min H-K, et al. The plasma lipidomic signature of nonalcoholic steatohepatitis. Hepatology. 2009;50(6):1827–38. doi: 10.1002/hep.23229 - DOI - PMC - PubMed