. 2025 Sep 2;122(35):e2509616122.
doi: 10.1073/pnas.2509616122. Epub 2025 Aug 28.

Organoid-based neutralization assays reveal a distinctive profile of SARS-CoV-2 antibodies and recapitulate the real-world efficacy

Affiliations

Organoid-based neutralization assays reveal a distinctive profile of SARS-CoV-2 antibodies and recapitulate the real-world efficacy

Zhixin Wan et al. Proc Natl Acad Sci U S A. .

Abstract

The efficacy of VIR-7831, a class 3 anti-SARS-CoV-2 monoclonal antibody (mAb), was demonstrated repeatedly in clinical trials; yet, reduced neutralization against Omicron variants in cell-line-based neutralization assays led to its withdrawal from clinical use. We developed organoid-based neutralization assays to measure mAb potency. We found that most class 3 mAbs, especially those not blocking receptor-binding domain-ACE2 binding, including VIR-7831, were substantially underestimated in cell-line-based assays. Nasal organoids adequately recapitulated the real-world effectiveness of VIR-7831 because of biologically relevant low ACE2 expression, and exclusively reproduced the in vivo protection of S2 mAbs due to the high TMPRSS2 expression, reminiscent of native human respiratory epithelial cells. Collectively, the robust organoid culture system and biologically relevant expression profiles of ACE2 and TMPRSS2 make nasal organoids present a correlate of in vivo protection of neutralizing mAbs exclusively. The organoid-based neutralization assays, superior to conventional cell-line-based assays, can recapitulate and predict the real-world efficacy of mAbs.

Keywords: SARS-CoV-2; neutralizing antibody; organoid.


Conflict of interest statement

Competing interests statement:C.L., M.C.C., K.Y.Y., and J.Z. are listed as inventors on the patent of nasal organoids (Application Number 63/358,795). Z.W, C.L., Y.Z., L.H., and J.Z. are listed as inventors on the patent of organoid-based neutralization assays. J.Z. is the founder of BiomOrgan Ltd. All other authors declare no competing interests.

Figures
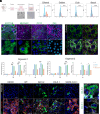
Fig. 1.
Fig. 1.
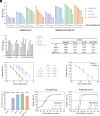
Characterizing nasal organoids of 96-transwell format and coronavirus infections. (A) A schematic graph outlines human nasal organoid derivation, expansion, and differentiation, including the derivation of nasal organoids from nasal cells, the expansion of undifferentiated nasal organoids in a 3D format, and the differentiation culture of nasal organoid monolayers onto 96-transwell inserts. A photomicrograph of the 3D undifferentiated organoids on day 6 and that of differentiated organoid monolayers on day 14 are shown underneath the corresponding stages. (Scale bar, 50 μm.) The schematic graph is created with BioRender. (B) Flow cytometry was performed to quantify the abundance of ciliated (ACCTUB+), goblet (MUC5AC+), club (CC10+), and basal (P63+) cells in the differentiated nasal organoid monolayers. Representative histograms show the percentage of cells labeled with cell-type-specific antibodies (red) and those labeled with isotype controls (blue). (C) Confocal images of ACCTUB+ ciliated cell, MUC5AC+ goblet cell, CC10+ club cell, and P63+ basal cell in differentiated nasal organoids. Nuclei and actin filaments were counterstained with DAPI (blue) and Phalloidin-647 (Purple), respectively. (Scale bar, 20 μm.) (D) Nasal organoids were costained for ciliated cells (ACCTUB, green), tight junctions (ZO-1, red), and F-actin filaments (Phalloidin-647, white). Nuclei were counterstained with DAPI (blue). (Scale bar, 20 µm.) (E and F) Nasal organoids were inoculated with the indicated SARS-CoV-1 and SARS-CoV-2 variants. Viral release from the apical side of nasal organoid monolayers was measured by RT-qPCR (Left) and TCID50 (Right) at the indicated hpi in organoids derived from two donors. Data represent means ± SD of three biological replicates. Two-way ANOVA with Tukey’s multiple comparison test was used for statistical analysis. *P < 0.05, **P < 0.01, ****P < 0.0001. (G) Immunofluorescent images of infected cells in nasal organoids after inoculation of the indicated virus; viral nucleoprotein (NP, green), ciliated cells (ACCTUB, red), DAPI (blue), and Phalloidin-647 (white). (Scale bar, 20 μm.) (H) Immunofluorescent images of syncytial bodies in nasal organoids infected by the indicated viruses. At 24 h after inoculation (MOI, 0.5), the organoid monolayers were fixed and costained for viral nucleoprotein (NP, green), F-actin filaments (Phalloidin-647, white), and nuclei (DAPI, blue). (Scale bar, 20 μm.)
Fig. 2.
Fig. 2.
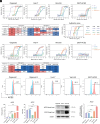
Fabricating nasal organoid-based neutralization assay and assessing mAb potency. (A) Nasal organoids and the indicated cell lines were inoculated with decreasing doses of SARS-CoV-1 and SARS-CoV-2 BA.4/5 pseudoviruses. At 72 h postinoculation, cell lysates were harvested for luciferase assay to assess pseudovirus entry. The results show the relative luciferase activity (relative light unit) of the indicated pseudovirus versus pseudovirus particles without carrying an envelope protein. Data represent the means ± SD in a representative experiment (n = 4) independently performed twice. (B) Signal window and Z-factor of the indicated pseudovirus infection in the indicated models. The Left panel presents the means ± SD in a representative experiment (n = 20). (C and D) The neutralization potency of a vaccination serum of SARS-CoV-2 WT was tested against the indicated pseudovirus entry in nasal organoids. Simple linear regression analysis was used to assess the correlation between inhibition and dilution factor. (C) Nasal organoids derived from one donor were applied to test the neutralization activity of the vaccination serum against the indicated pseudoviruses; (D) Nasal organoids derived from three different donors were applied to evaluate the serum neutralization against SARS-CoV-2 WT pseudovirus. (E) Viral RNA released from nasal organoids 24 hpi of SARS-CoV-1 (1 MOI) or SARS-CoV-2 variants (0.01 MOI) and Z-factor values (n = 20). (F and G) The neutralization curves of LY-CoV1404 and IC50s to the indicated pseudoviruses (F) and (G) authentic viruses. The horizontal dotted lines indicate a 50% neutralization. Data represent means ± SD (n = 4).
Fig. 3.
Fig. 3.
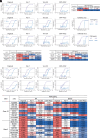
Distinct neutralization profile of VIR-7831 related to the ACE2 expression level. (A) Neutralization curves of VIR-7831 against the indicated pseudoviruses in organoids and the cell lines. Data show the mean ± SD (n = 4). (B) The heatmap shows the IC50 and IC90 values (ng/mL) of VIR-7831 against the indicated pseudoviruses. The neutralizing potency is red-white-blue color-coded, with red being the strongest neutralization of each mAb to the indicated pseudoviruses among the test models. (C) The neutralization curve of VIR-7831 against the indicated authentic viruses in nasal organoids. The horizontal dotted line indicates 50% neutralization. Data are mean ± SD (n = 4). (D) Neutralization activity of BD55-3152 against the indicated pseudoviruses in organoids and the cell lines. Data show the mean ± SD (n = 4). The heatmap shows the IC50 and IC90 values (ng/mL) of BD55-3152 against the indicated pseudoviruses. The neutralizing potency is red-white-blue color-coded, with red being the strongest neutralization of each mAb to the indicated pseudoviruses among the test models. (E–G) ACE2 expression in two lines of organoids and the indicated cell lines was analyzed by flow cytometry. (E) Representative histograms show the percentage of ACE2+ cells (red) in the organoids and cell lines. Isotype control (blue). (F) The percentage of ACE2+ cells and (G) MFI in the organoids and cell lines. Data represent the means ± SD of a representative experiment (n = 3). Two-tailed Student’s t test. ****P < 0.0001. (H) A representative western blot of short and long exposure reveals ACE2 expression in organoids and indicated cell lines. The experiment was independently performed three times. (I) GAPDH normalized ACE2 mRNA expression in two lines of organoids and cell lines. Data are presented as mean ± SD (n = 3) of a representative experiment independently performed three times. Two-tailed Student’s t test. ***P < 0.001, ****P < 0.0001.
Fig. 4.
Fig. 4.
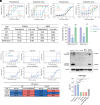
Higher neutralizing potency of class 3 antibodies than class 1 antibodies in organoids. (A) The neutralization curve and heatmap of S2E12 against indicated pseudoviruses in organoids and cell lines. (BF) The neutralization curve and heatmap of REGN10987 and REGN10933. (G and H) AZD1061 and AZD8895 against indicated pseudoviruses or authentic viruses in organoids and cell lines. The horizontal dotted lines indicate 50% neutralization. Data are presented as mean ± SD (n = 4). (I) Neutralization activity of mAbs of class 1/2 and class 3 in different models against SARS-CoV-2 WT and BA.4/5 pseudoviruses. The neutralizing activity is red-white-blue color-coded, with red being the strongest neutralization of each mAb among the test models.
Fig. 5.
Fig. 5.
The in vivo protection of S2 antibodies was reproduced in organoid-based neutralization assays. The neutralization curve of (A) CC40.8, (B) S2P6, and (C) IC50 values against different pseudoviruses or live viruses in nasal organoids. Data are mean ± SD (n = 4). (D) The indicated pseudovirus entry into nasal organoids in the presence or absence of the serine protease inhibitors was measured by luciferase assay. The results show the relative luciferase activity of the inhibitor-treated organoids versus that of DMSO-treated organoids (n = 4). Data represent the mean ± SD of a representative experiment. Statistics were determined by one-way ANOVA with Tukey’s multiple comparisons test. ***P < 0.001, ****P < 0.0001. ns, not significant. (E) Neutralization curves and heatmap of three S2 mAbs against SARS-CoV-2 WT and BA.4/5 pseudoviruses in Vero E6 and Vero E6-TMPRSS2 cell lines. The neutralizing activity is red-blue color-coded, with red being the strongest of each mAb in different cell lines. (F) The representative western blot shows TMPRSS2 expression in organoids and indicated cell lines. Western blot was independently performed three times. (G) Flow cytometry analysis shows the MFI of TMPRSS2 in different models. Data represent the means ± SD of a representative experiment, n = 3. Two-tailed unpaired Student’s t test. ***P < 0.001, ****P < 0.0001.

References

    1. Planas D., et al. , Distinct evolution of SARS-CoV-2 omicron XBB and BA.2.86/JN.1 lineages combining increased fitness and antibody evasion. Nat. Commun. 15, 2254 (2024). - PMC - PubMed
    1. Kaku Y., et al. , Virological characteristics of the SARS-CoV-2 KP.3, LB.1, and KP.2.3 variants. Lancet Infect. Dis. 24, e482–e483 (2024). - PubMed
    1. Ju B., et al. , Infection with wild-type SARS-CoV-2 elicits broadly neutralizing and protective antibodies against omicron subvariants. Nat. Immunol. 24, 690–699 (2023). - PMC - PubMed
    1. Jian F., et al. , A generalized framework to identify SARS-CoV-2 broadly neutralizing antibodies. bioRxiv [Preprint] (2024). 10.1101/2024.04.16.589454 (Accessed 16 April 2024). - DOI
    1. Wang K., et al. , Memory B cell repertoire from triple vaccinees against diverse SARS-CoV-2 variants. Nature 603, 919–925 (2022). - PMC - PubMed

MeSH terms

LinkOut - more resources