. 2025 Aug 29;16(1):657.
doi: 10.1038/s41419-025-07989-z.

DJ-1 counteracts Caveolin-1-mediated necroptosis to inhibit epithelial barrier dysfunction in colitis

Affiliations

DJ-1 counteracts Caveolin-1-mediated necroptosis to inhibit epithelial barrier dysfunction in colitis

Mengli Yu et al. Cell Death Dis. .

Abstract

Caveolin-1 (CAV1), a pivotal protein implicated in endothelial cell-mediated angiogenesis, assumes an ambiguous role with elusive underlying mechanisms in the pathogenesis of inflammatory bowel disease (IBD). In this investigation, we delineated the involvement of CAV1 in murine models of dextran sulfate sodium (DSS)-induced colitis. CAV1 knockout mice manifested attenuated pathological and inflammatory damage to the epithelium, whereas mice overexpressing CAV1 exhibited contrasting outcomes. In vivo, the accumulation of epithelial CAV1 contributed to the disruption of the epithelial barrier by promoting necroptosis. Subsequent mechanistic analyses revealed that the colitis-protective protein DJ-1 regulated CAV1 through a proteasome-mediated protein degradation pathway. Utilizing necroptosis-modeled organoids from murine intestines and pharmacological inhibition of necroptosis, our findings demonstrated that the DJ-1/CAV1 pathway governed epithelial inflammation via necroptosis in the context of colitis. In summary, our research revealed that epithelial CAV1 aggravated necroptosis in experimental colitis, leading to impairment of the epithelial barrier, which was negatively regulated by DJ-1.


Conflict of interest statement

Competing interests: The authors declare no competing interests. Ethics approval: All animal experiments were performed according to guidelines approved by the laboratory animal welfare and ethics review committee of Zhejiang University (approval No. ZJU20250339). And all clinical researches were approved by the ethical committee of the Fourth Affiliated Hospital Zhejiang University School of Medicine (approval No. K2025080).

Figures

Fig. 1
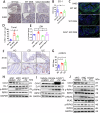
Fig. 1. Intestinal CAV1 expression was increased in IBD patients and DSS-treated mice.
A, B Bioinformatics analysis of CAV1 mRNA expression in the GEO database, A GSE16879 containing 6 healthy controls (HC), 24 UC patients and 19 CD patients before infliximab treatment, B GSE59071 containing 11 healthy controls, 97 UC patients and 8 CD patients. C Representative IHC analysis of CAV1 expression in colonic tissue samples from the healthy controls and the patients with UC or CD (magnification ×200; scale bar = 50 µm). D Statistical analysis of CAV1 expression in the healthy controls (n = 14), patients with UC (n = 10), and patients with CD (n = 12). E, F Western blotting of CAV1 protein expression in the control mice and the DSS-treated mice. Whole colon tissue (E) and the isolated colonic epithelium (F) were shown. All data are the means ± SD. *p < 0.05, **p < 0.01, ***p < 0.001, ****p < 0.0001, two-tailed.
Fig. 2
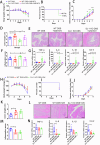
Fig. 2. CAV1 promoted DSS-induced experimental colitis.
AG WT and CAV1 KO mice were treated with 3.5% DSS for 7 days. WT NC = 3, CAV1 KO NC = 3, WT DSS = 8, CAV1 KO DSS = 7. Body weight change (A), survival rates (B), the disease activity index (DAI) (C) and colon length (D) were calculated. Mice were sacrificed on Day 7, and (E) histological changes in colon tissue samples from the WT and CAV1 KO mice were measured (magnification ×100; scale bar=100 µm). F Semiquantitative scoring of histopathology was performed. G Quantitative PCR analysis of cytokines and chemokines in colons from the DSS-treated mice. HN Male C57BL/6 mice were infected with RFP-tagged CAV1-overexpressing AAV7 (AAV-OE-CAV1) or the negative control AAV7 (AAV-NC) then administered DSS for 7 days. AAV-NC DSS = 11; AAV-OE CAV1 DSS = 6. Body weight change (H), survival rates (I), DAI scores (J), colon length (K) were measured. L Histological changes are shown (magnification ×100; scale bar=200 µm). M Semiquantitative scoring of histopathology was performed, and N quantitative PCR analysis of inflammatory markers was calculated. DAI scores and inflammation scores are expressed as median and IQR. Other All data are the means ± SD. *p < 0.05, **p < 0.01, ***p < 0.001, ****p < 0.0001, two-tailed.
Fig. 3
Fig. 3. CAV1 disrupted intestinal barrier function by promoting epithelial necroptosis.
A Representative IHC analysis of ZO-1 expression in colonic tissue samples from the WT and CAV1 KO mice (upper: magnification ×100;scale bar = 100 µm, lower: magnification ×400;scale bar = 20 µm). B Quantification of IHC quantification analysis of ZO-1 (n = 4) expression. C TUNEL staining and IHC staining of ZO-1 in colonic tissue samples from the above groups (TUNEL magnification ×400, scale bar=100 µm). D Quantification of TUNEL (green) staining and nuclear DAPI (blue) (n = 4). E LDH levels in culture medium supernatant were measured in the CAV1 knockdown HCT116 cells after stimulation with 100 ng/ml TNF-α for 24 h (n = 4). F Representative IHC analysis of p-MLKL expression in colonic tissue samples from the healthy controls (HC) and the patients with UC or CD (upper: magnification ×100; scale bar = 100 µm, lower: magnification ×400; scale bar = 20 µm). G Statistical analysis of p-MLKL expression (n = 5). CAV1 was knocked down (H) or overexpressed (I) for 24 h in HCT116 cells, and then, necroptosis was induced with 100 ng/ml TNF-α and 25 µM zVAD-fmk (TZ) for 24 h. An equal amount of DMSO was added as the solvent control. J Western blot analysis of necroptosis marker expression in HT29 cells after CAV1 knockdown and TZ stimulation. All data are the means ± SD. *p < 0.05, **p < 0.01, ****p < 0.0001, two-tailed.
Fig. 4
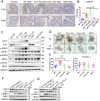
Fig. 4. DJ-1 was required for CAV1 degradation through direct protein-protein interactions.
A Representative IHC analysis of DJ-1 expression in colonic tissue samples from healthy controls and patients with UC or CD (magnification ×200; scale bar = 50 µm). B Statistical analysis of DJ-1 expression in the healthy controls (n = 13), patients with UC (n = 10) or CD (n = 11). C Correlation analysis of the CAV1 and DJ-1 IHC staining IOD/area score is shown (n = 36). D HCT116 cells were infected with a FLAG-tagged CAV1 overexpression plasmid or the empty vector (vehicle), and total FLAG-tagged CAV1 was immunoprecipitated. E Endogenous co-IP: HEK-293 cell lysates were immunoprecipitated with anti–DJ-1 or control IgG antibodies. F Endogenous co-IP: HT29 cell lysates were immunoprecipitated with anti–DJ-1 or control IgG antibodies. G Representative images of immunofluorescence staining of IBD human colon sections (DJ-1: green, CAV1: red, DAPI nuclear: blue, magnification ×600). H Western blot analysis of colonic CAV1 protein levels in the WT and DJ-1 KO mice with DSS-induced colitis. I Quantitative analysis of the above CAV1 protein levels (n = 4). J HEK293 cells infected with FLAG-tagged CAV1, HA-tagged DJ-1 plasmid and empty vector were stimulated with 100 ng/ml TNF-α and 25 µM zVAD-fmk for 24 h and then treated with MG132 (25 µM, I) for another 6 h. All data are the means ± SD. *p < 0.05, ***p < 0.001, ****p < 0.0001, two-tailed.
Fig. 5
Fig. 5. CAV1 knockout rescued DSS-induced colitis in DJ-1deficient mice.
WT, DJ-1 KO, CAV1 KO and DKO mice were treated with DSS for 7 days. WT NC = 5, WT DSS = 12, DJ-1 KO DSS = 12, CAV1 KO DSS = 6, DKO DSS = 5. Body weight change (A), survival rates (B) and the disease activity index (C) were monitored daily. D Mouse colon lengths were measured after sacrifice. E Intestinal permeability was evaluated by measuring the concentration of FITC-dextran in the blood serum. Histological scores (F) were determined in a double-blinded manner, and the histological analysis of colon tissue samples is shown (G) (upper: magnification ×100; scale bar = 100 µm, lower: magnification ×400; scale bar = 20 µm). H Quantitative PCR analysis was used to assess cytokine and chemokine production in whole-colon homogenates. DAI scores and inflammation scores are expressed as median and IQR. Other All data are the means ± SD. *p < 0.05, **p < 0.01, ***p < 0.001, ****p < 0.0001, ns no significant, two-tailed.
Fig. 6
Fig. 6. CAV1 promoted epithelial necroptosis under the regulation of DJ-1.
A Representative IHC analysis of p-RIPK1 expression in colonic tissue samples (IHC upper: magnification ×100;scale bar = 100 µm, lower: magnification ×400;scale bar = 20 µm). B Quantification of IHC analysis of p-RIPK1 (WT NC = 5, WT DSS = 6, DJ-1 KO DSS = 7, CAV1 KO DSS = 4, DKO DSS = 5) expression. C Western blotting was used to analyze CAV1, DJ-1 and necroptosis signaling pathway molecule protein levels in colon tissue samples from the mice treated as described above. D Intestinal organoids from the WT, DJ-1 KO, CAV1 KO and DKO mice treated as indicated with the combination of TNF-α (100 ng/ml) and zVAD-fmk (25 µM) (TZ), or TZ+ necrostatin-1 (Nec-1, 30 µM) for 12 h and stained with PI (red) for 24 h (magnification ×200;scale bar = 50 µm). E Quantification of PI intensities. n = 12 organoids from 3 mice per group. F DJ-1 and CAV1 expression were knocked down in HCT116 cells, and the cells were stimulated with TZ for 24 h. G Western blot analysis of DJ-1 and CAV1 overexpression in the TZ-stimulated HCT116 cells. All data are the means ± SD. *p < 0.05, **p < 0.01, ***p < 0.001, ****p < 0.0001, two-tailed.
Fig. 7
Fig. 7. Pharmacologic inhibition of necroptosis relieved DJ-1 deficiency-induced experimental colitis.
WT and DJ-1 KO mice were treated with 2 mg/ml GSK’872 every two days by intraperitoneal injection after 7 days of DSS administration. WT DSS = 7, WT DSS + GSK’872 = 9, DJ-1 KO DSS = 7, DJ-1 KO DSS + GSK’872 = 6. Body weight change (A), survival rates (B) and the DAI scores (C) were scored daily. Mice were sacrificed on Day 7, and colon lengths (D) were measured. E HE staining in colon tissue samples from the WT and DJ-1 KO mice is shown (magnification ×100; scale bar=100 µm). F Semiquantitative histopathological scoring was performed. G Quantitative PCR analysis of cytokines and chemokines in colons from the WT and DJ-1 KO DSS-treated mice. The WT and DJ-1 KO mice were treated with 1 mg/ml GW806742X (GW) for each day by intraperitoneal injection under a 7-day DSS administration. WT DSS = 5; WT DSS + GW = 7; DJ-1 KO + GW = 7. Body weight change (H), survival rates (I) and DAI scores (J) were scored daily. Colon lengths (K) were measured. H&E staining (L) in colon tissue samples is shown, and semiquantitative scoring of histopathology (M) was performed (upper: magnification ×40; scale bar = 500 µm, lower: magnification ×100; scale bar=200 µm). N Quantitative PCR analysis of cytokines and chemokines in colons. DAI scores and inflammation scores are expressed as median and IQR. Other All data are the means ± SD. *p < 0.05, **p < 0.01, ***p < 0.001, ****p < 0.0001, two-tailed.

References

    1. Kobayashi T, Siegmund B, Le Berre C, Wei SC, Ferrante M, Shen B, et al. Ulcerative colitis. Nat Rev Dis Prim. 2020;6:74. - PubMed
    1. Molodecky NA, Soon IS, Rabi DM, Ghali WA, Ferris M, Chernoff G, et al. Increasing incidence and prevalence of the inflammatory bowel diseases with time, based on systematic review. Gastroenterology. 2012;142:46–54.e42. - PubMed
    1. Peyrin-Biroulet L, Loftus EV Jr., Colombel JF, Sandborn WJ. The natural history of adult Crohn’s disease in population-based cohorts. Am J Gastroenterol. 2010;105:289–97. - PubMed
    1. Schroeder F, Huang H, McIntosh AL, Atshaves BP, Martin GG, Kier AB. Caveolin, sterol carrier protein-2, membrane cholesterol-rich microdomains and intracellular cholesterol trafficking. Sub-Cell Biochem. 2010;51:279–318. - PubMed
    1. Cohen AW, Hnasko R, Schubert W, Lisanti MP. Role of caveolae and caveolins in health and disease. Physiological Rev. 2004;84:1341–79. - PubMed

LinkOut - more resources