. 2025 Aug 28;16(1):654.
doi: 10.1038/s41419-025-07977-3.

DCAF7 recruits USP2 to facilitate hepatocellular carcinoma progression by suppressing clockophagy-induced ferroptosis

Affiliations

DCAF7 recruits USP2 to facilitate hepatocellular carcinoma progression by suppressing clockophagy-induced ferroptosis

Honglv Jiang et al. Cell Death Dis. .

Abstract

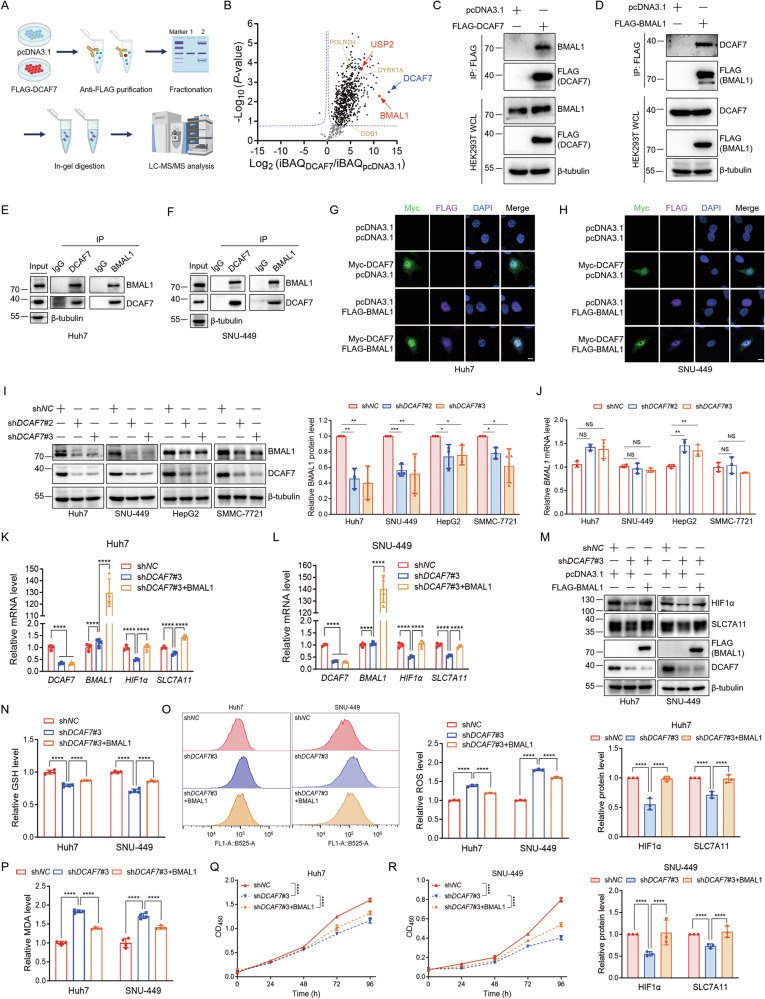
DDB1- and CUL4-associated factor 7 (DCAF7) has recently been identified as a critical regulator of tumorigenesis and a potential modulator of ferroptosis. However, the precise function of DCAF7 in regulating the progression of hepatocellular carcinoma (HCC) ferroptosis remains elusive. In this study, we demonstrate that DCAF7 and the deubiquitinase USP2 are highly expressed in HCC. Genetic ablation of DCAF7 or pharmacological inhibition of USP2 sensitizes HCC to ferroptosis and inhibits HCC progression both in vitro and in vivo. Mechanistically, DCAF7 recruits USP2 to inhibit clockophagy (the selective autophagic degradation of core clock protein BMAL1 mediated through p62/SQSTM1) by reducing BMAL1 K63-linked polyubiquitination. Targeting either DCAF7 or USP2 triggers clockophagy-induced ferroptosis through the HIF1α-SLC7A11 axis in HCC cells. Collectively, our study establishes DCAF7 and USP2 as novel suppressors of clockophagy-induced ferroptosis and reveals the potential therapeutic targets for HCC treatment.


Conflict of interest statement

Competing interests: The authors declare no competing interests. Ethics approval: This study was conducted in compliance with all relevant guidelines and regulations. Full informed consent was obtained from all human participants, and the study protocol was approved by the Ethics Committee of Soochow University (Approval No: SUDA20240522H04). The animal experiments were strictly adhered to protocols approved by the Ethics Committee of Soochow University (Approval No: SUDA20240522A03).

Figures

Fig. 1
Fig. 1. DCAF7 is highly expressed in HCC and promotes HCC progression.
A and B The DCAF7 mRNA level in normal and HCC tissues obtained from two GEO datasets, GSE214846 and GSE105130. C Waterfall plot of the relative DCAF7 mRNA level measured by qPCR from 27 HCC and paired paratumor tissues. Each bar represents one case. D The DCAF7 protein level in HCC and matched paratumor tissues. Mean ± SD (n = 27). E Western blotting analysis of the overexpressed DCAF7 in HCC cells. F and G The OD450 of HCC cells transfected with either an empty vector or FLAG-DCAF7 plasmid. Mean ± SD (n = 3, biological replicates). H Colony formation assays of HCC cells transfected with either an empty vector or FLAG-DCAF7 plasmid. Mean ± SD (n = 4, biological replicates). I Western blotting analysis of cell lysates from the control and DCAF7-knockdown HCC cells. J and K The OD450 of HCC cells transfected with siNC or siDCAF7. Mean ± SD (n = 3, biological replicates). L Colony formation assays of HCC cells transfected with siNC or siDCAF7. Mean ± SD (n = 4, biological replicates). MO Xenograft experiment. shNC or shDCAF7 Huh7 cells (1 × 106) were subcutaneously injected into nude mice (n = 6 for each group). Tumor volumes (M), images (N), and tumor weight (O) were depicted (mean ± SD). P and Q The survival analysis of HCC patients with different expression levels of DCAF7 mRNA. The data were obtained from the Kaplan–Meier plotter database (https://kmplot.com) (P) and the Human Protein Atlas database (https://www.proteinatlas.org) (Q). The P-values were calculated using two-tailed, unpaired Student’s t-test (A, B, H, L, O) or paired Student’s t-test (D), two-way ANOVA analysis with a Sidak’s multiple comparisons post hoc test (F, G, J, K, and M), and Log-rank analysis (P, Q). ***P < 0.001, ****P < 0.0001.
Fig. 2
Fig. 2. DCAF7 deficiency induces ferroptosis to suppress HCC progression through the HIF1α-SLC7A11 axis.
A and B The relative cell viability of siNC or siDCAF7-transfected Huh7 cells treated with different concentrations of the ferroptosis inducer Erastin (A) or RSL3 (B) for 24 h. Mean ± SD (n = 3, biological replicates). C and D The OD450 of siNC or siDCAF7-transfected HCC cells treated with DMSO or Fer-1 (1 μM) for different durations. Mean ± SD (n = 3, biological replicates). EG The relative intracellular GSH (E), ROS (F), and MDA (G) levels for the control or DCAF7-knockdown HCC cells. Mean ± SD (n = 3, biological replicates). H qPCR analysis of ferroptosis-related genes in the control or DCAF7-knockdown HepG2 and SMMC-7721 cells. I Western blotting analysis of SLC7A11 in the control or DCAF7-knockdown HCC cells. Mean ± SD (n = 3, biological replicates). JL The relative intracellular GSH (J), ROS (K), and MDA (L) levels in the control or DCAF7-knockdown Huh7 and SNU-449 cells transfected with an empty vector or HA-SLC7A11 plasmid. Mean ± SD (n = 3, biological replicates). M Western blotting analysis of HIF1α and SLC7A11 in the control or DCAF7-knockdown HCC cells. Mean ± SD (n = 3, biological replicates). NP qPCR and Western blotting analysis of the relative mRNA (N and O) and protein level (P) of SLC7A11 in the control or DCAF7-knockdown HCC cells transfected with an empty vector or HA-HIF1α plasmid. Mean ± SD (n = 3, biological replicates). QS The relative intracellular GSH (Q), ROS (R), and MDA (S) levels for the control or DCAF7-knockdown Huh7 and SNU-449 cells transfected with an empty vector or HA-HIF1α plasmid. Mean ± SD (n = 3, biological replicates). The P-values were calculated using two-tailed, unpaired Student’s t-test (EG, I, and M), one-way ANOVA analysis with a Tukey’s multiple comparisons post hoc test (JL, and NS), and two-way ANOVA analysis with a Sidak’s multiple comparisons post hoc test (AD). *P < 0.05, **P < 0.01, ***P < 0.001, ****P < 0.0001.
Fig. 3
Fig. 3. DCAF7 stabilizes BMAL1 to upregulate HIF1α transcription.
A and B IP-MS/MS analysis of the DCAF7-interacting proteins. The schematic (A) and the volcano plot (B) of the DCAF7-interacting proteins obtained by IP-MS/MS analyses. DYRK1A, DDB1, and POLR2H were labeled as reported positive DCAF7-interacting proteins in the volcano plots. CF Co-immunoprecipitation of DCAF7 and BMAL1 exogenously or endogenously. G and H Immunofluorescence analyses of the colocalization of DCAF7 and BMAL1 in Huh7 (G) and SNU-449 (H) cells. Scar bar: 10 μm. I and J Western blotting and qPCR analyses of BMAL1 protein (I) and mRNA (J) levels in the control or DCAF7-knockdown HCC cells. Mean ± SD (n = 3, biological replicates). KM qPCR analyses of the relative HIF1α and SLC7A11 mRNA levels (K and L) and Western blotting analyses of HIF1α and SLC7A11 protein (M) in the control or DCAF7-knockdown Huh7 and SNU-449 cells transfected with an empty vector or FLAG-BMAL1 plasmid. Mean ± SD (n = 3, biological replicates). NP The relative intracellular GSH (N), ROS (O), and MDA (P) levels in the control or DCAF7-knockdown Huh7 and SNU-449 cells transfected with an empty vector or FLAG-BMAL1 plasmid. Mean ± SD (n = 3, biological replicates). Q and R The OD450 of the control or DCAF7-knockdown HCC cells transfected with an empty vector or FLAG-BMAL1 plasmid. Mean ± SD (n = 3, biological replicates). The P-values were calculated using two-tailed, unpaired Student’s t-test (I and J), one-way ANOVA analysis with a Tukey’s multiple comparisons post hoc test (KP), and two-way ANOVA analysis with a Sidak’s multiple comparisons post-test (Q and R). NS, P > 0.05, *P < 0.05, **P < 0.01, ***P < 0.001, ****P < 0.0001.
Fig. 4
Fig. 4. DCAF7 inhibits clockophagy to stabilize BMAL1.
A and B Analysis of the BMAL1 protein turnover under DCAF7 overexpression (A) or knockdown (B) conditions. Cycloheximide (CHX): 200 μg/mL. Mean ± SD (n = 3, biological replicates). C Western blotting analysis and quantification of BMAL1 in HEK293T cells transfected with an empty vector or HA-DCAF7 plasmid in the absence or presence of MG132 (10 μM) or BafA1 (100 nM), respectively, for 12 h. Mean ± SD (n = 3, biological replicates). D and E Western blotting analysis and quantification of BMAL1 in HEK293T (D) and HepG2 (E) cells transfected with an empty vector or HA-DCAF7 plasmid in the absence or presence of CQ (50 μM) for 12 h. Mean ± SD (n = 3, biological replicates). F Analysis and quantification of the BMAL1-p62 interaction in the absence or presence of DCAF7. Mean ± SD (n = 3, biological replicates). G Western blotting analysis and quantification of the effect of DCAF7 on BMAL1 protein level in the control or p62-knockdown HEK293T cells. Mean ± SD (n = 3, biological replicates). H Analysis of the BMAL1 ubiquitination in the absence or presence of DCAF7 in p62-knockdown HEK293T cells. I Analysis of the type of polyubiquitin chain on BMAL1 regulated by DCAF7 in the p62-knockdown HEK293T cells. The P-values were calculated using a two-tailed, unpaired Student’s t-test (CG) and two-way ANOVA analysis with a Sidak’s multiple comparisons post-test (A, B). NS, P > 0.05, **P < 0.01, ****P < 0.0001.
Fig. 5
Fig. 5. DCAF7 recruits USP2 to deubiquitinate BMAL1 and inhibit clockophagy.
A Western blotting analysis and quantification of BMAL1 in HEK293T cells transfected with an empty vector or HA-DCAF7 plasmid and treated with or without MLN4924 (1 μM) for 24 h. Mean ± SD (n = 3, biological replicates). B Western blotting analysis and quantification of the effect of DCAF7 on BMAL1 protein level in the control or DDB1-knockdown HepG2 cells. Mean ± SD (n = 3, biological replicates). C and D Western blotting analysis and quantification of BMAL1 in HEK293T cells transfected with an empty vector or Myc-USP2b plasmid and treated with or without MG132 (10 μM) (C), or CQ (50 μM) (D) for 12 h, respectively. Mean ± SD (n = 3, biological replicates). E Analysis of the BMAL1-p62 interaction in the absence or presence of USP2b. Mean ± SD (n = 3, biological replicates). F Analysis of the BMAL1 ubiquitination in the absence or presence of USP2b or its catalytically inactive mutant USP2bC67A in p62-knockdown HEK293T cells. G Analysis of the type of polyubiquitin chain on BMAL1 regulated by USP2b in the p62-knockdown HEK293T cells. H Immunofluorescence analysis of the colocalization of DCAF7, BMAL1, and USP2 in Huh7 and SNU-449 cells. Scar bar: 10 μm. I Analysis and quantification of the BMAL1-USP2b interaction in the absence or presence of DCAF7. Mean ± SD (n = 3, biological replicates). J Analysis of the effect of DCAF7 on BMAL1 ubiquitination in p62-knockdown HEK293T cells treated with or without the USP2 inhibitor ML364 (10 μM) for 12 h. K Western blotting analysis and quantification of the effect of DCAF7 on BMAL1 protein level in HEK293T cells treated with or without ML364 (10 μM) for 12 h. Mean ± SD (n = 3, biological replicates). L Western blotting analysis and quantification of the effect of USP2b on BMAL1 protein level in the control (shNC) or DCAF7-knockdown (shDCAF7) HEK293T cells. Mean ± SD (n = 3, biological replicates). M Western blotting analysis and quantification of the effect of ML364 (10 μM, 12 h) on BMAL1 protein level in the control or DCAF7-knockdown HepG2 cells. Mean ± SD (n = 3, biological replicates). The P-values were calculated using a two-tailed, unpaired Student’s t-test (AE, I, and KM). NS, P > 0.05, *P < 0.05, **P < 0.01, ***P < 0.001, ****P < 0.0001.
Fig. 6
Fig. 6. USP2 inhibits DCAF7 autophagic degradation and modulates ferroptosis.
A Effect of ML364 on DCAF7 and BMAL1 proteins in HepG2 cells treated with PBS or CQ (50 μM) for 12 h. Mean ± SD (n = 3, biological replicates). B Effect of USP2b on DCAF7 protein in HEK293T cells treated with PBS or CQ (50 μM) for 12 h. Mean ± SD (n = 3, biological replicates). C Analysis of USP2b on the DCAF7 and BMAL1 protein turnover. CHX: 200 μg/mL. Mean ± SD (n = 3, biological replicates). D Analysis of USP2b on the DCAF7 ubiquitination in p62-knockdown HEK293T cells. E Analysis of USP2b on the DCAF7-p62 interaction. Mean ± SD (n = 3, biological replicates). F Effect of USP2b on DCAF7 protein in the control or p62-knockdown HEK293T cells. Mean ± SD (n = 3, biological replicates). G Analysis of the effect of ML364 on DCAF7, BMAL1, HIF1α, and SLC7A11 protein. Mean ± SD (n = 3, biological replicates). H and I The relative cell viability of HCC cells treated with ML364 and RSL3 for 24 h. Mean ± SD (n = 3, biological replicates). J and K The relative cell viability of HCC cells treated with DMSO, RSL3 (2 μM for Huh7, 1 μM for SNU-449), or RSL3 and Fer-1(1 μM) and ML364 (4 μM) for 24 h. Mean ± SD (n = 3, biological replicates). LN The relative GSH (L), ROS (M), and MDA (N) levels in HCC cells treated with ML364. Mean ± SD (n = 3, biological replicates). O and P The OD450 of the HCC cells treated with ML364. Mean ± SD (n = 3, biological replicates). Q and R The relative cell viability of the control and DCAF7-knockdown HCC cells treated with ML364 and RSL3 for 24 h. Mean ± SD (n = 3, biological replicates). The P-values were calculated using two-tailed, unpaired Student’s t-test (A, B, E, F, J, K), one-way ANOVA analysis with a Tukey’s multiple comparisons post hoc test (GI, LN, Q, R), and two-way ANOVA analysis with a Sidak’s multiple comparisons post hoc test (C, O, P). NS, P > 0.05, *P < 0.05, **P < 0.01, ***P < 0.001, ****P < 0.0001.
Fig. 7
Fig. 7. Targeting DCAF7 or USP2 sensitizes HCC cells to sorafenib by inducing ferroptosis.
A and B The relative cell viability of the shNC and shDCAF7-HCC cells treated with different concentrations of sorafenib for 24 h. Mean ± SD (n = 3, biological replicates). C Schematic representation of the treatment schedule of sorafenib and Fer-1 for shNC or shDCAF7 Huh7 xenografted mice. DG Images (D), growth curves (E), tumor weight (F), and MDA (G) of the shNC or shDCAF7-expressing Huh7 xenografted mice treated as indicated. Mean ± SD (n = 6 mice per group). H and I The relative viability of HCC cells treated with the indicated concentrations of ML364 and sorafenib for 24 h. Mean ± SD (n = 3, biological replicates). J and K The relative viability of HCC cells treated with the indicated concentrations of ML364 and sorafenib (20 μM for Huh7, 10 μM for SNU-449) in the absence or presence of Fer-1 (1 μM) for 24 h. Mean ± SD (n = 3, biological replicates). L and M The OD450 of the HCC cells treated with ML364 (2 μM), sorafenib (2 μM), or the combination treatment of sorafenib (2 μM) and ML364 (2 μM) for different durations. Mean ± SD (n = 3, biological replicates). N Schematic representation of the therapy schedule of sorafenib, ML364, or combination therapy for Huh7 xenografted mice. OR Images (O), growth curves (P), tumor weight (Q), and MDA (R) of the Huh7 xenografted mice treated as indicated. Mean ± SD (n = 6 mice per group). The P-values were calculated using one-way ANOVA analysis with a Tukey’s multiple comparisons post hoc test (F–K, Q, and R), and two-way ANOVA analysis with a Sidak’s multiple comparisons post hoc test (A, B, E, L, M, and P). NS, P > 0.05, *P < 0.05, **P < 0.01, ***P < 0.001, ****P < 0.0001.
Fig. 8
Fig. 8. Clinical relevance of the DCAF7/USP2/BMAL1-HIF1α-SLC7A11 axis in HCC.
AF The two-tailed Pearson correlation analyses of the abundance of the indicated proteins in HCC tissue samples. GH Waterfall plot of the relative SLC7A11 (G) and HIF1α (H) mRNA level measured by qPCR from 27 HCC and paired adjacent tissues. Each bar represents one case. I Representative images for DCAF7, USP2, and BMAL1 staining in human HCC tissue microarray samples. Scale bars represent 200 μm and 50 μm. JL The staining scores for the indicated proteins in a tissue microarray with 75 paired HCC and matched adjacent tissues were compared. MO The two-tailed Pearson correlation analyses of the staining scores of indicated proteins with a tissue microarray containing 75 paired HCC clinical tissue specimens. The P-values were calculated using a two-tailed, paired Student’s t-test (JL). ***P < 0.001, ****P < 0.0001.

References

    1. Xu J, Ye Z, Zhuo Q, Gao H, Qin Y, Lou X, et al. MEN1 degradation induced by neddylation and the CUL4B-DCAF7 axis promotes pancreatic neuroendocrine tumor progression. Cancer Res. 2023;83:2226–47. - PubMed
    1. Li QJ, Fang XL, Li YQ, Lin JY, Huang CL, He SW, et al. DCAF7 acts as a scaffold to recruit USP10 for G3BP1 deubiquitylation and facilitates chemoresistance and metastasis in nasopharyngeal carcinoma. Adv Sci. 2024;11:e2403262. - PMC - PubMed
    1. Miyata Y, Shibata T, Aoshima M, Tsubata T, Nishida E. The molecular chaperone TRiC/CCT binds to the Trp-Asp 40 (WD40) repeat protein WDR68 and promotes its folding, protein kinase DYRK1A binding, and nuclear accumulation. J Biol Chem. 2014;289:33320–32. - PMC - PubMed
    1. Yu D, Cattoglio C, Xue Y, Zhou Q. A complex between DYRK1A and DCAF7 phosphorylates the C-terminal domain of RNA polymerase II to promote myogenesis. Nucleic Acids Res. 2019;47:4462–75. - PMC - PubMed
    1. Tian M, Zhi JY, Pan F, Chen YZ, Wang AZ, Jia HY, et al. Bioinformatics analysis identifies potential ferroptosis key genes in the pathogenesis of diabetic peripheral neuropathy. Front Endocrinol. 2023;14:1048856. - PMC - PubMed

MeSH terms

Substances

LinkOut - more resources