. 2025 Aug 28;16(1):8037.
doi: 10.1038/s41467-025-62479-2.

Epigenetically conferred ring-stage survival in Plasmodium falciparum against artemisinin treatment

Affiliations

Epigenetically conferred ring-stage survival in Plasmodium falciparum against artemisinin treatment

Xinyu Yu et al. Nat Commun. .

Abstract

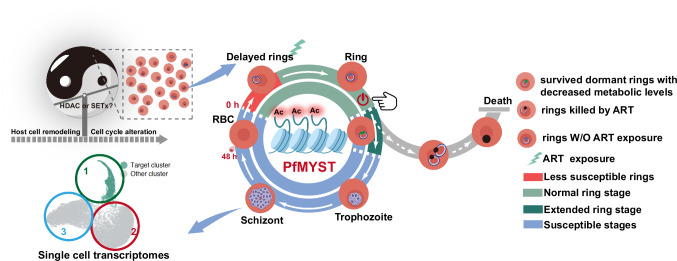
Artemisinin and its semisynthetic derivatives (ART) are crucial medicines in artemisinin-based combination therapies worldwide. Despite ART's efficacy, small proportions of young intraerythrocytic ring stage parasites can survive the drug's short half-life, and dormant forms can cause recrudescence if not cleared by partner drugs. Certain mutations in the Kelch propeller region of P. falciparum protein (PfK13) are linked to the higher ring-stage survival (RS), which above 1% can be a feature of 'artemisinin partial resistance'. Emerging evidence indicates epigenetic modulators may contribute to RS. Here, we report systematic evaluations of all putative histone acetyltransferases (HATs) of P. falciparum in 30 culture-adapted field isolates and 43 subcloned field isolates. Only PfMYST shows a full association with RS phenotype modulations. Knockdown experiments confirm the linkage of Pfmyst expression to these modulations, with evidence of altered metabolic processes. Through single-cell RNA sequencing, ChIP-seq analysis, and CRISPR/cas9 genetic manipulation, PfMYST-targeted RS-related genes have been identified and functionally validated. Multi-omics analysis indicates significant interplay of PfMYST and PfK13 mechanisms in RS. PfMYST epigenetic modulation extends to other antimalarials, including amodiaquine, pyrimethamine, chloroquine, and pyronaridine. Collectively, our findings provide important information on the epigenetic regulatory mechanism of P. falciparum RS after pulses of ART and other antimalarials.


Conflict of interest statement

Competing interests: The authors declare no competing interests.

Figures

Fig. 1
Fig. 1. The Impact of PfK13 Mutation and HATs Expression Levels on RSA in Cloned or Field-Adapted Parasites.
a Two isolates bearing mutations in the PfK13 gene, A5 (G538V) and A8 (C580Y), were reverted to the WT sequences via CRISPR-Cas9 gene editing technique, leading to the creation of A5_R (G538) and A8_R (C580), respectively. b RSA0-3h for the PfK13 mutant parasites: A8 (C580Y) and A5 (G538V); PfK13 WT parasites: A8_R (C580) and A5_R (G538). Data were presented as mean ± SEM from four independent experiments with technical duplicates. P-values were determined using the two-tailed student’s t test. c RSA0-3h for WT 3D7 strain and subclones of A8 (C580Y), A8_R (C580), A5 (G538V) and A5_R (G538) isolates with 50 nM, 200 nM and 700 nM DHA, respectively. Data were presented as the mean value of survival rate (n = 4, 18, 10, 25 and 10 for each group with 3 technical replicates). d Correlation analysis between the transcription levels of 10 genes encoding histone acetyltransferases and ART susceptibility in the subclones of A5 and A8 field isolates. Parasites carrying G538V and C580Y mutations in PfK13 were adapted and subcloned for RT-qPCR assay and 0–3 h ring-stage survival assay. The 0–3 h ring-stage parasites were exposed to a 6-hour treatment with 700 nM DHA. Data were presented as mean value from three independent experiments with technical triplicates. Correlation analysis was conducted using GraphPad Prism 8.0 software. Source data are provided as a Source Data file.
Fig. 2
Fig. 2. PfMYST knockdown or inhibition leads to ring-stage survival and recrudescence in P. falciparum.
a Correlation analysis between the transcription levels of Pfmyst and ART susceptibility in field-adapted parasites (n = 28) carrying the WT PfK13 gene. Parasites were exposed to 50 nM DHA and then cultured normally for 66 hours. The correlation analysis was performed using GraphPad Prism 8.0 software, and data were presented as mean value from three independent experiments with technical triplicates. b Schematic illustrating the CRISPR/Cas9-mediated fusion of the glmS sequence and Ty1 tag at the 3’ terminus of PfMYST, resulting in the PfM-KD parasite line (Pfmyst-ty1-glmS). The fusion event was verified by PCR with gDNA extracted from the transfectant. Similar trends were observed in two independent experiments. c Intraerythrocytic growth curves of two subclones (C4, D5) of the Pfmyst-ty1-glmS line and the WT 3D7 control, with and without 5 mM GlcN treatment for 6 h. Data were presented as mean ± SEM from three independent replicates with technical triplicates. d Western Blot analysis of the Pfmyst-ty1-glmS line and WT 3D7 parasites, in which parasites were pretreated with 5 mM GlcN for 6 h and total protein extracts were obtained from ring, trophozoite, and schizont-stage parasites. The analysis utilized a commercial antibody against the Ty1 epitope, alongside Aldolase as the internal control. Similar trends were observed in two independent experiments; RT-qPCR analysis of Pfmyst transcript level at ring (0-6 hpi), trophozoite (20–26 hpi), and schizont-stage (36–42 hpi) with/without the exposure of GlcN. Data were presented as mean ± SEM from four independent experiments with technical triplicates. P-values were determined using the two-tailed student’s t test. e RSA with DHA concentrations ranging from 50 nM to 700 nM was tested on different parasites, including PfM-KD parasites with or without GlcN treatment, WT and Rrp6 knockdown parasites (Pfrrp6-Ty1-glmS). Data were presented as mean ± SEM from four independent experiments with technical duplicates. f The effects of histone acetyltransferase inhibitors on parasite RSA0-3h induced by DHA. WT parasites were pre-incubated with PfMYST specific inhibitor (NU9056) and PfGCN5 inhibitors (curcumin, and anacardic acid) for 12 h before RSA0-3h. Various DHA concentrations (50 nM, 200 nM, 700 nM) were tested. Data were presented as mean ± SEM from three independent experiments with technical triplicates. P-values were determined using One-way ANOVA with Bonferroni correction compared with vehicle control. CCM: curcumin, AA: anacardic acid. Source data are provided as a Source Data file.
Fig. 3
Fig. 3. PfMYST-mediated ART-R is linked to alterations in the parasite’s cell cycle and metabolism in P. falciparum.
a Intra-erythrocytic developmental stages of parasites observed in Giemsa-stained blood smears. Blood smears were prepared every 6 h to monitor the changes in stage development. The WT 3D7, Pfmyst-ty1-glmS without GlcN (PfM-KD (-), Pfmyst-ty1-glmS with GlcN (PfM-KD (+) and A8 (K13_C580Y) lines were monitored without or after 50 nM DHA pulse, respectively. A solid line was applied to mark the prolonged ring stage development. Similar trends were observed in two independent experiments. b Intra-erythrocytic development patterns of WT 3D7 and PfM-KD parasites given different exposures to GlcN followed by DHA treatment. Blood smears were conducted every 4 h, and the percentage of each stage parasite was obtained from two independent experiments. Curves were fitted to visualize the differences in stage developmental patterns, and data were presented as mean ± SEM from three independent experiments with technical duplicates. c Impact of 50 nM DHA treatment on parasite growth cycles. Changes in the SYTO-61 staining profile of viable parasites after drug exposure were monitored by FACS in the subsequent cycle. Growth retardation was observed in the DHA-treated PfMYST-KD parasites that were pre-treated with GlcN. d Assessment of stage-specific susceptibility for 3D7 and PfMYST-KD parasites using ART survival assays. Highly synchronized parasites were exposed to DHA during the intraerythrocytic developmental cycle (IDC) within specific time windows (RSA0-3h, RSA9-12h, and TSA18-21h), and the survival rates of the parasites were calculated. In parallel, control experiments were conducted using the same parasite strain without GlcN treatment. Data were presented as mean ± SEM from four independent experiments with technical duplicates. P-values were determined using One-way ANOVA with Bonferroni correction compared with 0–3 h samples. e The effect of repeated ART selection on RSA0-3h of PfMYST knockdown (PfM-KD (+)) and A8 (K13_C580Y) parasites, respectively. Data were presented as mean ± SEM from three independent experiments with technical triplicates. P-values were determined using One-way ANOVA with Bonferroni correction. No significant difference in RSA0-3h was observed among parasites selected from different rounds of 700 nM DHA treatment. Source data are provided as a Source Data file.
Fig. 4
Fig. 4. Metabolic changes in quiescent ring-stage parasites with PfMYST knockdown or PfK13 mutation.
a Recrudescence assay of the PfMYST-KD, WT 3D7, PfK13-modified 3D7 (K13_C580Y), A5 (K13_G538V), A5Rev (K13_G538), A8 (K13_C580Y) and A8Rev (K13_C580) lines. Assays of the 3D7 and PfMYST-KD lines were performed with (+) or withour (-) exposure of the starting populations to GlcN. Ring-stage parasites were exposed to three 6 h pulses at 700 nM DHA. Recrudescence curves were obtained based on parasitemia determined from Giemsa-stained smears. Data were presented as mean ± SEM from three independent experiments with technical duplicates. b Schematic workflow for the targeted metabolomics study. Elements were Created in BioRender (https://www.biorender.com/) with CC-BY 4.0 license (https://BioRender.com/e0ufn5x). (1) WT and PfMYST knockdown parasites (with GlcN treatment) were synchronized and exposed to 50 nM DHA or 0.1% DMSO (control) for 3 h/6 h. (2) After thorough washing, parasite pellets were swiftly quenched in dry ice, and the extracted metabolome was stored at − 80 °C. (3) High-resolution MS-based targeted metabolomics was conducted to analyze the alterations in energy metabolism. Two biological replicates were performed for each group. c Global analyses of metabolomic data revealed an alerted metabolic profile in parasites with either PfMYST-mediated or PfK13-associated resistance after DHA exposure. Highly synchronized parasites (0–3 hpi) were pre-treated with GlcN for 24 h and then subjected to a 3 or 6 h DHA pulse at a dosage of 50 nM in two independent biological replicates. Extracted metabolome for each group was then subjected to targeted metabolic profiling in which 19 key compounds involved in tricarboxylic acid cycle (TCA cycle), glycolytic pathway, pentose phosphate pathway and corresponding cofactors were simultaneously detected to assess alterations in energy metabolism. Statistical comparisons between samples subjected to vehicle control were conducted using a two-tailed student’s t test and significantly alerted metabolome were highlighted. The first - or + is corresponding to the exposure of GlcN, and the second − or + is corresponding to the exposure of DHA. Source data are provided as a Source Data file.
Fig. 5
Fig. 5. Single-cell RNA sequencing unveils PfMYST-mediated epigenetic tolerance to artemisinin in P. falciparum.
a Experimental design for single-cell RNA sequencing. Parasites with various genetic backgrounds, including WT3D7, PfMYST knockdown, PfK13-mutated 3D7 (Y493H), 3D7 (C580Y), A5 (G538V), A8 (C580Y), and A8Rev (C580Y reversion) strains, were treated with or without DHA (200 nM), and RNA was harvested at distinct time intervals. Elements were Created in BioRender (https://www.biorender.com/) with CC-BY 4.0 license (https://BioRender.com/k7aqvkw). GlcN: glucosamine. b UMAP visualization of PfMYST-associated scRNA-seq samples, colored by sample origin. 0 h samples predominantly cluster in the upper region, DHA-treated 6- and 9 h samples cluster to the right, and untreated 6- and 9 h samples cluster to the left. c UMAP plot of PfMYST knockdown and DHA treatment samples, revealing 12 distinct clusters. Clusters 6 and 12 identified as DHA target clusters. d Stacked bar chart depicting the percentage of each cell cluster in different samples. e Normalized cluster ratios between PfMYST knockdown (PfM-KD (+/+)_6h) and control parasites (PfM-KD (-/+)_6h) samples following the 6-hour DHA treatment. Higher cluster ratios observed in clusters 6 and 12 for PfM-KD ( + / + )_6. f Venn diagram showing differentially expressed genes (DEGs) between the target cluster and other clusters in PfMYST knockdown parasites (PfM-KD (+/+)_6h) and control parasites (PfM-KD (-/+)_6h) after the 6 h DHA treatment. The 46 DEGs unique to PfM-KD (+/+)_6h are identified as “PfMYST target genes” potentially contributing to prolonged ring-stage in PfMYST knockdown parasites. g Venn diagram showing overlap between “PfMYST target genes” and three PfK13-associated target gene sets. h Characterization of 21 PfMYST target genes overlapping with PfK13-associated targets, showing: gene IDs (first panel), gene annotations (second panel), fold change in expression between target cluster and other clusters for each sample (third and fifth panels), and fold change of ChIP signals after PfMYST knockdown for each histone modification in ring stage (fourth panel). i Gene ontology analysis of “PfMYST target genes” that are either PfMYST-specific or shared with PfK13-associated target genes. P-values were calculated using Fisher’s exact test, with Benjamini-Hochberg-adjusted and Bonferroni-adjusted P-values provided in Supplementary Data 11 and Supplementary Data 14. Source data are provided as a Source Data file.
Fig. 6
Fig. 6. Functional analysis of potential resistant genes in parasite RSA and the effects of PfMYST knockdown on various antimalarial RSA.
a Ten potential resistant genes in response to DHA treatment are functional validated by episomal over-expression (OE), knockout (KO) or knockdown (KD). The overall results of RSA0-3h assays of these transgenic lines are summarized in the last column. b Recrudescence Assay of PHISTb_KO, 2G4_KO, PHISTa_KO, DDX5_KO with the parent 3D7 line of transfection as control. Ring-stage parasites were exposed to three 6 h pulses at 700 nM DHA. Recrudescence curves were obtained based on parasitemia determined from Giemsa-stained smears. Data were presented as mean ± SEM from three independent experiments with technical duplicates. c,d RSA0-3h for over-expression (OE), knockout (KO) or knockdown (KD) of “PfMYST-targeted genes”. Two OE, four KO and four KD lines were tested for their RSA0-3h under 700 nM DHA treatment with WT 3D7 strain as a negative control. Data were presented as mean ± SEM from four independent experiments with technical duplicates. Statistical comparisons between vehicle control and GlcN-treated samples were conducted using a two-tailed student’s t test. Statistical comparisons between WT and mutant parasites were conducted using One-way ANOVA with Bonferroni correction, and the exact P-value was provided in Source Data. (*P < 0.05; ** P < 0.01; *** P < 0.001). e The impact of PfMYST knockdown on RSA0-3h for seven antimalarial drugs, including AQ, PYR, CQ, PYA, LMF, MEF, and PPQ. RSA0-3h was modified according to the IC50 of each drug, with drug concentrations set at 10 x IC50. Survival rates were calculated using the standard method. Data were presented as mean ± SEM from four independent experiments with technical duplicates. Statistical comparisons between vehicle control and GlcN-treated samples were conducted using a two-tailed student’s ttest. AQ: Amodiaquine, PYR: Pyrimethamine, CQ: Chloroquine, PYA: Pyronaridine, LMF: Lumefantrine, MEF: Mefloquine, PPQ: Piperaquine. f Relationship between the alerted resistance level and pharmacokinetic parameters, including drug half-life and Tmax. Drugs with increased/decreased resistance were displayed in red/green circles, respectively. Source data are provided as a Source Data file.
Fig. 7
Fig. 7. Schematic illustration of PfMYST-mediated DHA adaptive resistance.
Various levels of Pfmyst expression exist in the natural P. falciparum parasite population, affecting the expression of genes through epigenetic regulation. After exposure to DHA, some parasites in the targeted cluster with low Pfmyst expression display altered cell cycle timing and metabolic quiescence, promoting ring-stage survival and recrudescence after a period of dormancy. Elements were Created in BioRender (https://www.biorender.com/) with CC-BY 4.0 license (https://BioRender.com/o6aevoo.).

Similar articles

References

    1. Bhatt, S. et al. The effect of malaria control on Plasmodium falciparum in Africa between 2000 and 2015. Nature526, 207–211 (2015). - PMC - PubMed
    1. Li, G. Q., Arnold, K., Guo, X. B., Jian, H. X. & Fu, L. C. Randomised comparative study of mefloquine, qinghaosu, and pyrimethamine-sulfadoxine in patients with falciparum malaria. Lancet2, 1360–1361 (1984). - PubMed
    1. Giao, P. T. et al. Artemisinin for treatment of uncomplicated falciparum malaria: is there a place for monotherapy? Am. J. Tropical Med. Hyg.65, 690–695 (2001). - PubMed
    1. World Health Organization. Chemotherapy of malaria: report of a WHO scientific group. In World Health Organization Technical Report Series No. 375. (1967).
    1. Teuscher, F. et al. Artemisinin-induced dormancy in Plasmodium falciparum: duration, recovery rates, and implications in treatment failure. J. Infect. Dis.202, 1362–1368 (2010). - PMC - PubMed

MeSH terms

LinkOut - more resources