. 2025 Aug 28;16(1):8027.
doi: 10.1038/s41467-025-63411-4.

A graph homomorphism approach for unraveling histories of metastatic cancers and viral outbreaks under evolutionary constraints

Affiliations

A graph homomorphism approach for unraveling histories of metastatic cancers and viral outbreaks under evolutionary constraints

Kiril Kuzmin et al. Nat Commun. .

Abstract

Viral infections and cancers are driven by evolution of populations of highly mutable genomic variants. A key evolutionary process in these populations is their migration or spread via transmission or metastasis. Understanding this process is crucial for research, clinical practice, and public health, yet tracing spread pathways is challenging. Phylogenetics offers the main methodological framework for this problem, with challenges including determining the conditions when a phylogenetic tree reflects the underlying migration tree structure, and balancing computational efficiency, flexibility, and biological realism. We tackle these challenges using the powerful machinery of graph homomorphisms, a mathematical concept describing how one graph can be mapped onto another while preserving its structure. We focus on metastatic migrations and viral host-to-host transmissions in outbreak settings. We investigate how structural constraints on migration patterns influence the relationship between phylogenetic and migration trees and propose algorithms to evaluate trees consistency under varying conditions. Leveraging our findings, we introduce a framework for inferring transmission/migration trees by sampling potential solutions from a prior random tree distribution and identifying a subsample consistent with a given phylogeny. By varying the prior distribution, this approach generalizes several existing models, offering a versatile strategy applicable in diverse settings.


Conflict of interest statement

Competing interests: The authors declare no competing interests.

Figures

Fig. 1
Fig. 1. Relationship between phylogenetic and migration trees.
ac Percent of sampled trees (y-axis) that are consistent with given phylogenies across n = 816 test instances. df Area under the precision-recall curve (AUC, y-axis) calculated by varying the support threshold for n = 570 (degenerate prior), n = 815 (scale-free prior) and n = 800 (uniform prior) test instances with non-empty samples of consistent trees. Each boxplot displays the interquartile range (IQR) as the box, the median as the center line, whiskers extending to the furthest points within 1.5 × IQR, and outliers plotted beyond this range. Source data are provided as a Source Data file.
Fig. 2
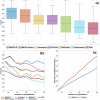
Fig. 2. Methods benchmarking.
a Summary statistics of methods performance on all simulated datasets (n = 1900 test instances in total). The boxplot displays the interquartile range (IQR) as the box, the median as the center line, whiskers extending to the furthest points within 1.5 × IQR, and outliers plotted beyond this range. Source data are provided as a Source Data file. b Median f-scores of different methods on simulated datasets with varying numbers of populations. c Median running times of SMiTH for the construction of a constrained homomorphism for a given phylogenetic tree and candidate migration tree as a function of the number of migration sites.
Fig. 3
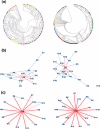
Fig. 3. The analysis of experimental HCV data.
a Phylogenetic trees of HCV variants from two outbreaks. Variants sampled from different hosts are highlighted in different colors. b Graphs formed by edges corresponding to adjacent tree nodes with unique Fitch labels. True edges are highlighted in red. c Consensus networks of the top 1% of sampled trees with respect to the objective (3). Edge thicknesses are proportional to their frequencies, true edges are highlighted in red.
Fig. 4
Fig. 4. Distributions of migration numbers for trees with different primary tumor sites across n = 50000 sampled trees.
Adnx: adnexa, ApC: appendix, Brn: brain, Bwl: bowel implant, CDSB: cul de sac, ClnE: sigmoid colon deposit, LOv: left ovary, LFTB,LFTC: left fallopian tube, Om: omentum, RFTA: left fallopian tube, ROv: right ovary, RPv: right pelvic mass, RUt: right uterosacral ligamen, SBwl: small bowel. Each boxplot displays the interquartile range (IQR) as the box, the median as the center line, whiskers extending to the furthest points within 1.5 × IQR, and outliers plotted beyond this range. Source data are provided as a Source Data file.
Fig. 5
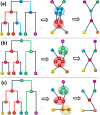
Fig. 5. Solutions for the Migration History Inference Problem under various constraints.
For each scenario, a phylogenetic tree is illustrated in two different layouts on the left and in the middle, with the corresponding migration tree displayed on the right. In the phylogenies, nodes are color-coded by their homomorphic images in the migration tree. The layout in the middle showcases how homomorphism transforms a phylogeny into a migration tree. a Unconstrained solution. Subtrees formed by blue and red nodes are not connected, indicating a violation of the convexity constraint. b Convex solution. Each color-coded subtree is connected, but compactness is violated in the subtree rooted at node 7. c Convex and compact solution.
Fig. 6
Fig. 6. Overview of the Dynamic Programming Algorithm for Detecting Convex Label-Distinctive Homomorphisms.
A A phylogenetic subtree, Ψα, rooted at node α with two children, β and γ. B Input candidate migration tree T. The goal is to produce convex homomorphisms from Ψα to induced subtrees of T from such homomorphisms for Ψβ and Ψγ. C Convex homomorphisms from Ψβ (top row) and Ψγ (bottom row) to induced subtrees of T. For instance, the top figure depicts a homomorphism to an induced 1-tree T[1, {4, 9, 10, 11}] that consists of the vertex 1, its neighbors 4, 9, 10, 11 and all vertices connected to 1 via paths that intersect these neighbors. Nodes of subtrees are colored by their homomorphic images. Homomorphisms are organized into a bipartite graph G, where edges connect homomorphism pairs f1f2 and f1f4 that are consistent, and there is no edge between homomorphisms f1 and f3, that are not consistent. D Homomorphisms f5 and f6 obtained by combining consistent homomorphisms f1f2 and f1f4.
Fig. 7
Fig. 7. SMiTH: Sampling MIgrations and Transmissions with Homomorphisms.
A Input phylogenetic tree. B Distribution of possible migration trees. Parallel rectangles depict a probability density function, with each rectangle’s width proportional to the corresponding probability. In practice, the distribution is represented either by a random graph model or by a stochastic graph generation procedure. C Candidate migration trees sampled from the distribution (B) using the specified random graph models (for instance, by selecting tree edges at random with pre-defined probabilities or by constructing the trees using a randomized graph growth model). D Homomorphisms from the phylogeny to three sampled trees. In the phylogenies, nodes are color-coded by their homomorphic images in a migration tree. The phylogeny layouts in the middle of each subfigure showcases how homomorphism transforms them into sampled trees. E: consensus solution derived from homomorphisms in D. The solution is shown as potential color distributions for the phylogeny’s nodes (left) or as a graph where possible migration edges are weighted according to the number of supporting solutions (right), with the edge thickness indicating weight.

Similar articles

References

    1. DeGregori, J. Adaptive Oncogenesis: A New Understanding of How Cancer Evolves Inside Us. (Harvard University Press, Cambridge, MA, 2018).
    1. Nowell, P. C. The clonal evolution of tumor cell populations: Acquired genetic lability permits stepwise selection of variant sublines and underlies tumor progression. Science194, 23–28 (1976). - PubMed
    1. Greaves, M. & Maley, C. C. Clonal evolution in cancer. Nature481, 306 (2012). - PMC - PubMed
    1. Yates, L. R. & Campbell, P. J. Evolution of the cancer genome. Nat. Rev. Genet.13, 795 (2012). - PMC - PubMed
    1. Bonavia, R., Cavenee, W. K. & Furnari, F. B. et al. Heterogeneity maintenance in glioblastoma: a social network. Cancer Res.71, 4055–4060 (2011). - PMC - PubMed

LinkOut - more resources