. 2025 Aug 28;16(1):7762.
doi: 10.1038/s41467-025-62806-7.

Regulatory role of the N-terminal intrinsically disordered region of the DEAD-box RNA helicase DDX3X in selective RNA recognition

Affiliations

Regulatory role of the N-terminal intrinsically disordered region of the DEAD-box RNA helicase DDX3X in selective RNA recognition

Yuki Toyama et al. Nat Commun. .

Abstract

DDX3X, a member of the DEAD-box RNA helicase family, plays a central role in the translational regulation of gene expression through its unwinding activity toward complex RNA structures in messenger RNAs (mRNAs). Although DDX3X is known to selectively stimulate the translation of a subset of genes, a specific sequence motif has not been identified; thus, the molecular mechanism underlying this selectivity remains elusive. Using solution nuclear magnetic resonance (NMR) spectroscopy, we demonstrate that the N-terminal intrinsically disordered region (IDR) of DDX3X plays a critical role in the binding and unwinding of structured RNAs. We propose that the selectivity toward target transcripts is mediated by its preferential binding to structured motifs, particularly the G-quadruplex structure, through arginine-rich segments within the N-terminal IDR. Our results provide a molecular basis for understanding translational regulation by DDX3X and highlight the remarkable role of the flexible IDR in controlling the cellular translational landscape.


Conflict of interest statement

Competing interests: The authors declare no competing interests.

Figures
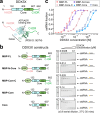
Fig. 1
Fig. 1. Structure of DDX3X and its helicase activity toward dsRNA.
a The domain architecture of DDX3X. The model structure of full-length DDX3X is shown below (PDB 5E7M). b dsRNA unwinding assays for IDR-truncated DDX3X variants. The domain architecture of each construct is shown on the left, and representative results of the dsRNA unwinding assays are shown on the right. In the gels, the upper band corresponds to the 18mer/36mer dsRNA, while the lower band corresponds to the 18mer ssRNA displaced from dsRNA by the unwinding activity of DDX3X. Protein concentrations were varied with a 0.6-fold serial dilution, with the maximum and minimum concentrations indicated at the top of each gel. The band of the Xylene Cyanol FF (XC) was included on the left as a standard. The reaction mixture was incubated for 30 min at 37 °C. c Plots of ssRNA fractions as a function of DDX3X concentration [M] after 30 min of incubation, using MBP-FL (circle), MBP-N-Core (square), MBP-Core-C (cross), MBP-Core (triangle), and Core (inverted triangle) proteins. Error bars represent the standard deviation of three independent measurements, with center indicating mean values. Source data are provided as a Source Data file.
Fig. 2
Fig. 2. NMR characterization of the interaction between the N-IDR and various RNA molecules.
a Schematic illustration of the NMR binding experiments between the N-IDR and various structured RNA molecules. b15N-1H HSQC spectrum of the [U-15N]-labeled N-IDR in the absence of RNA. c Plots of the secondary structure populations of the N-IDR obtained using the δ2D method. d NMR spectra and peak height ratios of the N-IDR signals obtained with and without each RNA molecule. For each sub-panel, the overlay of 15N-1H HSQC spectra of the [U-15N]-labeled N-IDR in the absence (navy) and presence (orange-red) of RNA, and the plot of peak height ratios are shown. The ratio was calculated by dividing the peak height in the presence of RNA by that in the absence of RNA. Residues that were not analyzed are indicated by gray backgrounds. Error bars were calculated using the signal-to-noise ratios. All NMR measurements were performed at 10 °C and 1 GHz in a buffer containing 20 mM potassium phosphate (pH 7.0), 200 mM KCl, 5 mM DTT, 260 units/mL RNAsin® Plus RNAase inhibitor, and 5% D2O. The protein concentration was 50 μM, and the RNA concentration was 50 μM (for poly-U10 ssRNA, GC-14mer dsRNA, 14mer tetraloop RNA, and telomeric GQ RNA) or 25 μM (for NRAS GQ RNA and NRAS mutant RNA). The 1D slices of the labeled signals are shown in each spectrum. Source data are provided as a Source Data file.
Fig. 3
Fig. 3. Telomeric GQ RNA titration experiments.
a Close-up views of 15N-1H HSQC spectra of the [U-15N]-labeled N-IDR in the presence of varying concentrations of telomeric GQ RNA (navy: 0 equimolar, turquoise: 0.2 equimolar, pink: 0.5 equimolar, and red: 1 equimolar). The KCl concentration was 200 mM. The 1D slices of the labeled signals are shown in each spectrum. b Amino acid distributions of aromatic (top, green and khaki), negatively charged (middle, red), and positively charged (bottom, blue) residues. The x-axis scale for the residue number is consistent with panel (c) below. c Plots of the peak height ratios of the N-IDR signals obtained with 0.2 (gray), 0.5 (purple), or 1.0 (navy) equimolar telomeric GQ RNA. d Plots of the peak height ratios of the N-IDR signals obtained with 200 mM (navy), 400 mM (purple), or 1 M (gray) KCl. e Plots of the peak height ratios of the wild-type (navy) and RtoK variant (gray) N-IDR signals obtained with 200 mM KCl. In panels d, and e, the ratio was calculated by dividing the peak height in the presence of 1 equimolar (50 μM) telomeric GQ RNA by that in the absence of RNA. Overlays of the imino 1H 1D (f) and uridine H5-H6 1H-1H TOCSY (g) NMR spectra of unlabeled telomeric GQ RNA recorded with and without the 1 equimolar unlabeled N-IDR. Residues with marked chemical shift changes are mapped onto the structure (PDB 2KBP). The sequence of the telomeric GQ RNA is shown above the structure. For panels (a), (c), (d), and (e), NMR measurements were performed at 10 °C and 1 GHz, with a protein concentration of 50 μM. Three arginine-rich (RR) regions are highlighted with blue lines in panels (c), (d), and (e). For panels (f) and (g), NMR measurements were performed at 25 °C and 1 GHz, with an RNA concentration of 50 μM. Source data are provided as a Source Data file.
Fig. 4
Fig. 4. GQ propensity of RAC1 and ODC1 5´-UTR and its interaction with the N-IDR.
a Plots of the prediction scores for GQ propensity of RAC1 (top) and ODC1 (bottom) 5′-UTR sequences obtained using the rG4detector software. In the insets, the sequences of the segments with high prediction scores (purple) and those of the negative controls (gold) are highlighted. b The imino 1H 1D NMR spectra of telomeric GQ RNA (top), NRAS GQ RNA (middle), and GC-14mer dsRNA (bottom). Regions with signals from canonical base pairs (blue) and Hoogsteen base pairs in GQ (purple) are indicated above the spectra. c The imino 1H 1D NMR spectra of RAC1 and ODC1 fragments are shown as in panel (b). For the ODC1 150–174 and ODC1 279–303 fragments, signal intensities were scaled by 4-fold and 2-fold, respectively, for visualization. d NMR spectra and peak height ratios of the N-IDR signals obtained with and without each RNA fragment in the presence of 200 mM KCl. In the top row, overlays of 15N-1H HSQC spectra of the [U-15N]-labeled N-IDR in the absence (navy) and presence (orange-red) of RNA are shown. The 1D slices of the labeled signals are shown in each spectrum. In the bottom row, plots of peak height ratios are shown. The ratio was calculated by dividing the peak height in the presence of 1 equimolar RNA by that in the absence of RNA. Error bars were calculated using the signal-to-noise ratios. Residues that were not analyzed are indicated with gray backgrounds. All NMR measurements were performed at 10 °C and 1 GHz, with protein and RNA concentrations of 50 μM. Source data are provided as a Source Data file.
Fig. 5
Fig. 5. GQ-unfolding activity of DDX3X.
a Schematic representation of the fluorescence-based NRAS GQ-unfolding assay. b Fluorescence emission spectra of FAM/BHQ1-labeled NRAS GQ recorded without (solid black line) and with (dotted magenta line) 400 nM complementary RNA after 20 min of incubation. The peak intensities are indicated by horizontal solid lines. c Native gel analyses of FAM/BHQ1-labeled NRAS GQ with and without the complementary RNA. The band of the Xylene Cyanol FF (XC) was included on the left as a standard. The analyses were independently repeated three times with consistent results. d Fluorescence emission spectra of FAM/BHQ1-labeled NRAS GQ recorded without (solid black line) and with (dotted magenta line) the MBP-FL (left), MBP-Core-C (middle), and N-IDR (right) proteins. The y-axis is labeled in arbitrary units (a.u.). The intensity ratios of the maximum fluorescence intensities of FAM/BHQ1-labeled NRAS GQ at each protein concentration are plotted below. Error bars represent the standard deviation of three (for MBP-Core-C and N-IDR) or four (for MBP-FL) independent measurements, with center indicating mean values. e Overlay of the spectra of [Metε-13C1H3]-labeled E348Q DDX3X Core measured without (gray) and with 4 equimolar poly-U10 ssRNA (pink). f Overlay of the spectra measured without (gray) and with 6 equimolar NRAS GQ (purple). g Overlay of the spectra measured with 6 equimolar NRAS GQ (purple, multiple contours) and with 4 equimolar poly-U10 ssRNA (pink, single contour). Schematic cartoons describing the interactions are shown below the spectra (PDB 5E7M and 2DB3),. In panels (e) and (f), the projections of the dotted region are shown in the inset. Free (F) and bound (B) signals are indicated for representative residues. All NMR measurements were performed at 35 °C and 1 GHz, with a protein concentration of 50 μM. Source data are provided as a Source Data file.
Fig. 6
Fig. 6. GQ propensity of DDX3X’s targets.
a Violin plots comparing the distributions of the predicted GQ fractions (top) and maximum GQ propensity scores (bottom) between DDX3X’s targets (TE-down; 208 transcripts) and non-targets (otherwise; 8783 transcripts). Three regions, 5′-UTR (left), protein coding (center), and 3′-UTR (right), were analyzed separately. The horizontal bars in the violin plots indicate the median values, while the top and bottom error bars represent the maximum and minimum values, respectively. Statistical significance between the two groups was evaluated using the two-sided Mann-Whitney U test (***: p < 0.001). All relevant data and exact p values are included in the Source Data file. b Cartoon representations of the interaction between an mRNA transcript containing the GQ structure and DDX3X.

References

    1. Rocak, S. & Linder, P. DEAD-box proteins: the driving forces behind RNA metabolism. Nat. Rev. Mol. Cell Biol.5, 232–241 (2004). - PubMed
    1. Linder, P. & Jankowsky, E. From unwinding to clamping - the DEAD box RNA helicase family. Nat. Rev. Mol. Cell Biol.12, 505–516 (2011). - PubMed
    1. Bourgeois, C. F., Mortreux, F. & Auboeuf, D. The multiple functions of RNA helicases as drivers and regulators of gene expression. Nat. Rev. Mol. Cell Biol.17, 426–438 (2016). - PubMed
    1. Bohnsack, K. E., Yi, S., Venus, S., Jankowsky, E. & Bohnsack, M. T. Cellular functions of eukaryotic RNA helicases and their links to human diseases. Nat. Rev. Mol. Cell Biol.24, 749–769 (2023). - PubMed
    1. Lai, M.-C., Lee, Y.-H. W. & Tarn, W.-Y. The DEAD-box RNA helicase DDX3 associates with export messenger ribonucleoproteins as well as tip-associated protein and participates in translational control. Mol. Biol. Cell19, 3847–3858 (2008). - PMC - PubMed

MeSH terms

LinkOut - more resources