. 2025 Aug 28;15(1):31716.
doi: 10.1038/s41598-025-13969-2.

Natural compounds attenuate combined chromium and arsenic-induced oxidative stress and nephritic apoptosis by activating the Nrf2/Keap1 signaling and associated xenobiotic metabolizing enzymes

Affiliations

Natural compounds attenuate combined chromium and arsenic-induced oxidative stress and nephritic apoptosis by activating the Nrf2/Keap1 signaling and associated xenobiotic metabolizing enzymes

Swapnil Tripathi et al. Sci Rep. .

Abstract

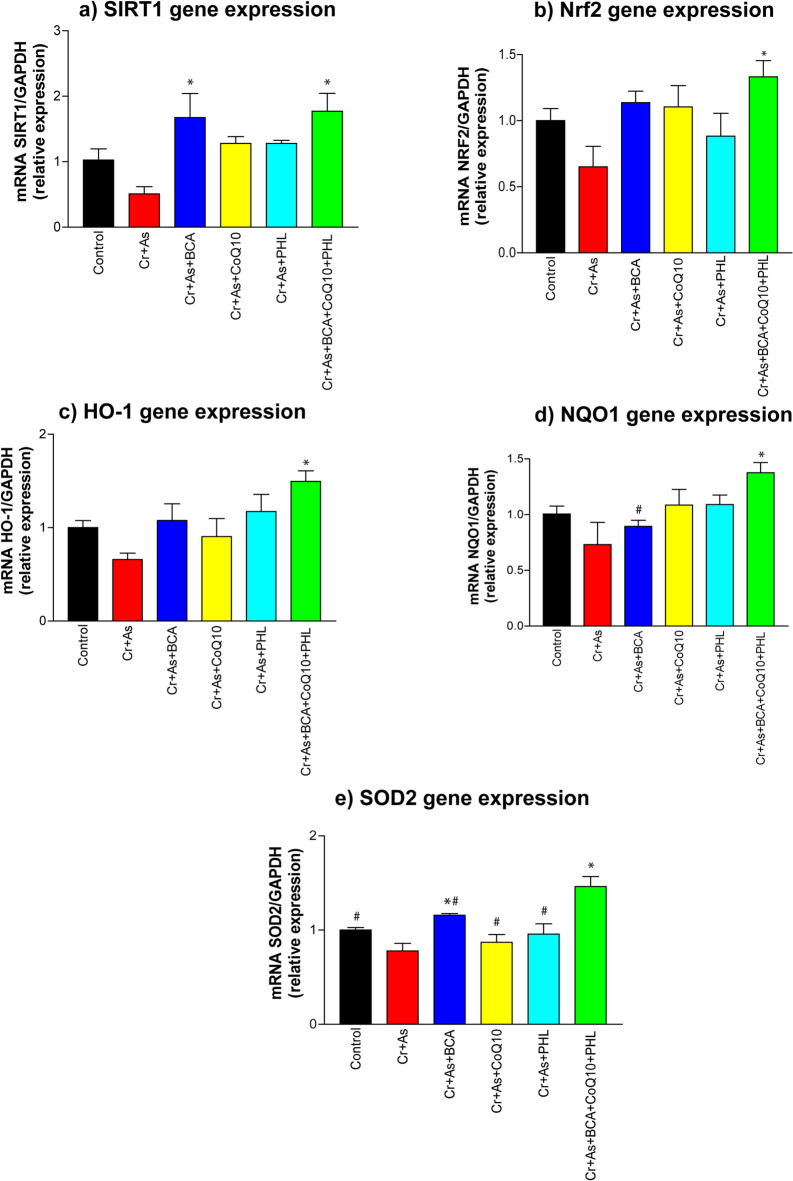
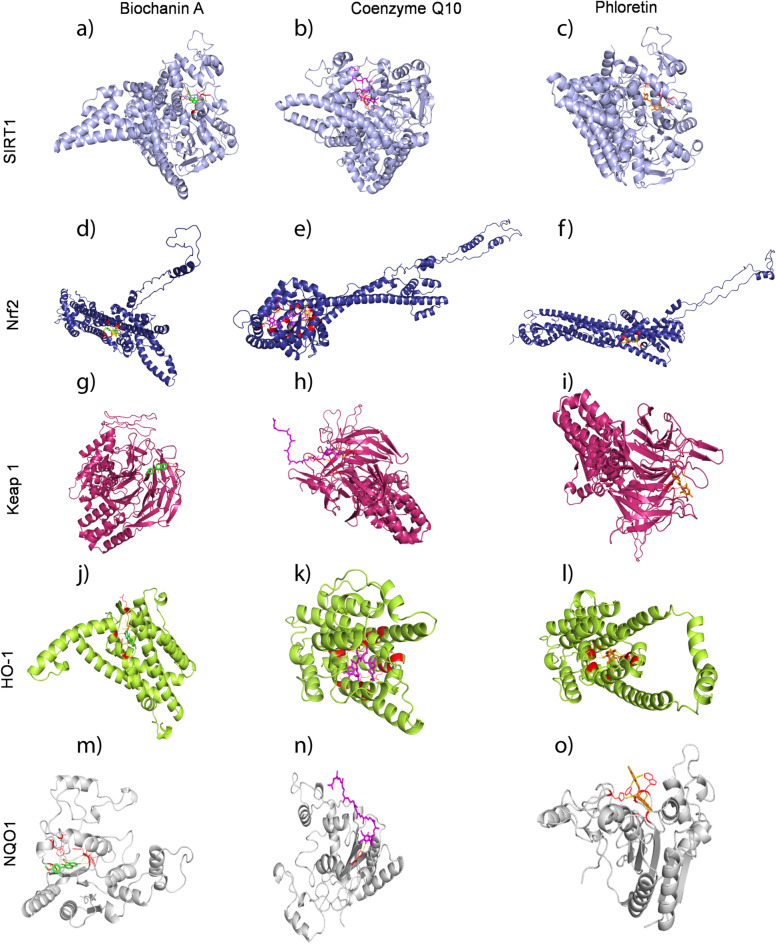
Chromium (Cr) and arsenic (As) pose a threat to the exposed population, leading to various renal ailments. Although individual toxicity has been well investigated, little is known about their combined effects. In light of the mounting concern over the environmental impact of heavy metals, the current study investigated the potential benefits of the selected nutraceuticals, i.e., biochanin-A (BCA), coenzyme Q10 (CoQ10), and phloretin (PHL) in combined Cr + As intoxicated Swiss albino mice, providing a comprehensive understanding of the mechanism of action. During the two-week investigation, Cr (75 ppm) and As (100 ppm) were given orally to induce renal toxicity, and were simultaneously treated with BCA (50 mg/kg), CoQ10 (10 mg/kg), and PHL (50 mg/kg) intraperitoneally. The Cr + As-treated group showed an increase in kidney somatic index, metal burden, protein carbonylation, and malondialdehyde, along with a decrease in the activity of (superoxide dismutase, catalase, glutathione-S-transferase, reduced glutathione, and total thiol). Furthermore, DNA degradation, histology, and altered SIRT1/Nrf2/HO‑1/NQO1/SOD2/CYP1A1/KEAP1/CAS-8, and CAS-3 gene expressions corroborated the above findings. Alternatively, co-treatment with the selected antioxidants reversed the above mentioned parameters, highlighting the protective effects of these compounds against Cr + As-induced oxidative damage. Nrf2, a key player in this process, is responsible for the activation of the antioxidant response element and subsequent expression of antioxidant enzymes. We further investigated the possible interactions of BCA, CoQ10, and PHL with the antioxidant enzymes/proteins, SIRT1/Nrf2/KEAP1/HO-1/NQO1, using in silico studies. Our study offers new avenues for the future of chronic kidney disease treatment associated with Cr + As-induced exposure, providing a deeper understanding of the role of Nrf2 in this context.

Keywords: Arsenic; Biochanin-A; Chromium; Coenzyme Q10; Phloretin; Reactive oxygen species.


Conflict of interest statement

Competing interests: The authors declare that they have no known competing financial interests or personal relationships that could have appeared to influence the work reported in this paper.

Figures

Fig. 1
Fig. 1
Overview pictorial summary of the study.
Fig. 2
Fig. 2
The flowchart of the experimental design.
Fig. 3
Fig. 3
Kidney weight in experimental groups (Group1: control; Group 2: Cr; Group 3: As; Group 4: Cr + As; Group 5: Cr + As + BCA; Group 6: Cr + As + CoQ10; Group 7: Cr + As + PHL; Group 8: Cr + As + BCA + CoQ10 + PHL). Values represented as the mean ± SE.
Fig. 4
Fig. 4
Chromium (Cr) and arsenic (As) concentration evaluation amid all groups (Group 1: control; Group 2: Cr/As; Group 3: Cr + As + BCA + CoQ10 + PHL). Expressed values as the mean ± SEM; wt: weight. Values represented as the mean ± SE; * indicates significant difference from Cr + As co-exposed group, # indicates significant difference from Cr + As + BCA + CoQ10 + PHL. The significant difference is set at p < 0.05.
Fig. 5
Fig. 5
SOD estimation in experimental groups (Group1: control; Group 2: Cr; Group 3: As; Group 4: Cr + As; Group 5: Cr + As + BCA; Group 6: Cr + As + CoQ10; Group 7: Cr + As + PHL; Group 8: Cr + As + BCA + CoQ10 + PHL). Values represented as the mean ± SE; * indicates significant difference from Cr + As co-exposed group. The significant difference is set at p < 0.05.
Fig. 6
Fig. 6
CAT estimation in experimental groups (Group1: control; Group 2: Cr; Group 3: As; Group 4: Cr + As; Group 5: Cr + As + BCA; Group 6: Cr + As + CoQ10; Group 7: Cr + As + PHL; Group 8: Cr + As + BCA + CoQ10 + PHL). Values represented as the mean ± SE. * indicates significant difference from Cr + As co-exposed group. The significant difference is set at p < 0.05.
Fig. 7
Fig. 7
GST estimation in experimental groups (Group1: control; Group 2: Cr; Group 3: As; Group 4: Cr + As; Group 5: Cr + As + BCA; Group 6: Cr + As + CoQ10; Group 7: Cr + As + PHL; Group 8: Cr + As + BCA + CoQ10 + PHL). Values represented as the mean ± SE; * indicates significant difference from Cr + As co-exposed group. The significant difference is set at p < 0.05.
Fig. 8
Fig. 8
GSH estimation in experimental groups (Group1: control; Group 2: Cr; Group 3: As; Group 4: Cr + As; Group 5: Cr + As + BCA; Group 6: Cr + As + CoQ10; Group 7: Cr + As + PHL; Group 8: Cr + As + BCA + CoQ10 + PHL). Values represented as the mean ± SE; * indicates significant difference from Cr + As co-exposed group. The significant difference is set at p < 0.05.
Fig. 9
Fig. 9
TT estimation in experimental groups (Group1: control; Group 2: Cr; Group 3: As; Group 4: Cr + As; Group 5: Cr + As + BCA; Group 6: Cr + As + CoQ10; Group 7: Cr + As + PHL; Group 8: Cr + As + BCA + CoQ10 + PHL). Values represented as the mean ± SE; * indicates significant difference from Cr + As co-exposed group. The significant difference is set at p < 0.05.
Fig. 10
Fig. 10
PCC estimation in experimental groups (Group1: control; Group 2: Cr; Group 3: As; Group 4: Cr + As; Group 5: Cr + As + BCA; Group 6: Cr + As + CoQ10; Group 7: Cr + As + PHL; Group 8: Cr + As + BCA + CoQ10 + PHL). Values represented as the mean ± SE; * indicates significant difference from Cr + As co-exposed group, @ indicates significant difference from As exposed group. The significant difference is set at p < 0.05.
Fig. 11
Fig. 11
LPO estimation in experimental groups (Group1: control; Group 2: Cr; Group 3: As; Group 4: Cr + As; Group 5: Cr + As + BCA; Group 6: Cr + As + CoQ10; Group 7: Cr + As + PHL; Group 8: Cr + As + BCA + CoQ10 + PHL). Values represented as the mean ± SE; * indicates significant difference from Cr + As co-exposed group. The significant difference is set at p < 0.05.
Fig. 12
Fig. 12
DNA gel electrophoresis (in experimental groups (Group1: control; Group 2: Cr + As; Group 3: Cr + As + BCA; G4: Cr + As + CoQ10; G5: Cr + As + PHL; G6: Cr + As + BCA + CoQ10 + PHL).
Fig. 13
Fig. 13
Histopathology of kidney sections. Figure 13A-F represents photomicrograph of each experimental group. (Group1: control; Group 2: Cr + As; Group 3: Cr + As + BCA; Group 4: Cr + As + CoQ10; Group 5: Cr + As + PHL; Group 6: Cr + As + BCA + CoQ10 + PHL). Arrows indicate mononuclear cell infiltration. Original magnification-200X.
Fig. 14
Fig. 14
Gene expression analyses in the kidney tissue of the experimental mice (a) SIRT1, (b) Nrf2, (c) HO-1, (d) NQO1, (e) SOD2, (f) CYP1A1, (g) KEAP1, (h) CAS-8, and (i) CAS-3. (Group1: control; Group 2: Cr + As; Group 3: Cr + As + BCA; Group 4: Cr + As + CoQ10; Group 5: Cr + As + PHL; Group 6: Cr + As + BCA + CoQ10 + PHL). Values represented as the mean ± SE; * indicates significant difference from Cr + As co-exposed group, # indicates significant difference from Cr + As + BCA + CoQ10 + PHL, $ indicates significant difference from Cr + As + BCA. The significant difference is set at p < 0.05.
Fig. 14
Fig. 14
Gene expression analyses in the kidney tissue of the experimental mice (a) SIRT1, (b) Nrf2, (c) HO-1, (d) NQO1, (e) SOD2, (f) CYP1A1, (g) KEAP1, (h) CAS-8, and (i) CAS-3. (Group1: control; Group 2: Cr + As; Group 3: Cr + As + BCA; Group 4: Cr + As + CoQ10; Group 5: Cr + As + PHL; Group 6: Cr + As + BCA + CoQ10 + PHL). Values represented as the mean ± SE; * indicates significant difference from Cr + As co-exposed group, # indicates significant difference from Cr + As + BCA + CoQ10 + PHL, $ indicates significant difference from Cr + As + BCA. The significant difference is set at p < 0.05.
Fig. 15
Fig. 15
In silico binding of BCA, CoQ10, PHL (a) Docked conformation of BCA, CoQ10, PHL ligand at the binding site of SIRT1 receptor. (b) Docked conformation of BCA, CoQ10, PHL ligand at the binding site of Nrf2 receptor. (c) Docked conformation of BCA, CoQ10, PHL ligand at the binding site of KEAP1 receptor. (d) Docked conformation of BCA, CoQ10, PHL ligand at the binding site of HO-1 receptor. (e) Docked conformation of BCA, CoQ10, PHL ligand at the binding site of NQO1 receptor. BCA, CoQ10, PHL ligands are shown in stick style and coloring scheme is atom type. The interacting amino acids in the receptor are shown in line style, and rest of the amino acid residues in secondary structure representation.
Fig. 16
Fig. 16
PPI analyses of target genes. Interactions between monitored proteins (a) SIRT1, (b) Nrf2, (c) HO-1, (d) NQO1, (e) SOD2, (f) CYP1A1, (g) KEAP1, (h) CAS-8, and (i) CAS-3 estimated using STRING 12 database.
Fig. 17
Fig. 17
GO analysis using ShinyGo identified enriched biological processes of target genes. The green dots represent the nodes for each GO biological process, while the lines represent the interaction between the nodes (minimum of 20% genes common between two connected) GO processes.
Fig. 18
Fig. 18
A schematic diagram of different mechanisms of cytoprotection rendered by the selected natural compounds (BCA, CoQ10, PHL) against Cr and As-induced nephrotoxicity. BCA, biochanin‐A; CoQ10, coenzyme Q10; PHL, phloretin.

Similar articles

References

    1. Pratush, A., Kumar, A. & Hu, Z. Adverse effect of heavy metals (As, pb, hg, and Cr) on health and their bioremediation strategies: a review. Int. Microbiol.21 (3), 97–106 (2018). - PubMed
    1. Hingston, J. A. et al. Leaching of chromated copper arsenate wood preservatives: a review. Environ. Pollut. 111 (1), 53–66 (2001). - PubMed
    1. Maduabuchi, J. M. et al. Arsenic and chromium in canned and non-canned beverages in nigeria: a potential public health concern. Int. J. Environ. Res. Public. Health. 4 (1), 28–33 (2007). - PMC - PubMed
    1. Poonia, T., Singh, N. & Garg, M. Contamination of arsenic, chromium and fluoride in the Indian groundwater: a review, meta-analysis and cancer risk assessment. Int. J. Environ. Sci. Technol.18, 2891–2902 (2021).
    1. Goswami, R. et al. Potential arsenic-chromium-lead Co-contamination in the hilly terrain of Arunachal pradesh, north-eastern india: genesis and health perspective. Chemosphere323, 138067 (2023). - PubMed