. 2025 Aug 28;9(1):304.
doi: 10.1038/s41698-025-01098-y.

Collagen disorder architecture features are associated with clinical, molecular, genetic factors and survival outcomes in colon cancer

Affiliations

Collagen disorder architecture features are associated with clinical, molecular, genetic factors and survival outcomes in colon cancer

Reetoja Nag et al. NPJ Precis Oncol. .

Abstract

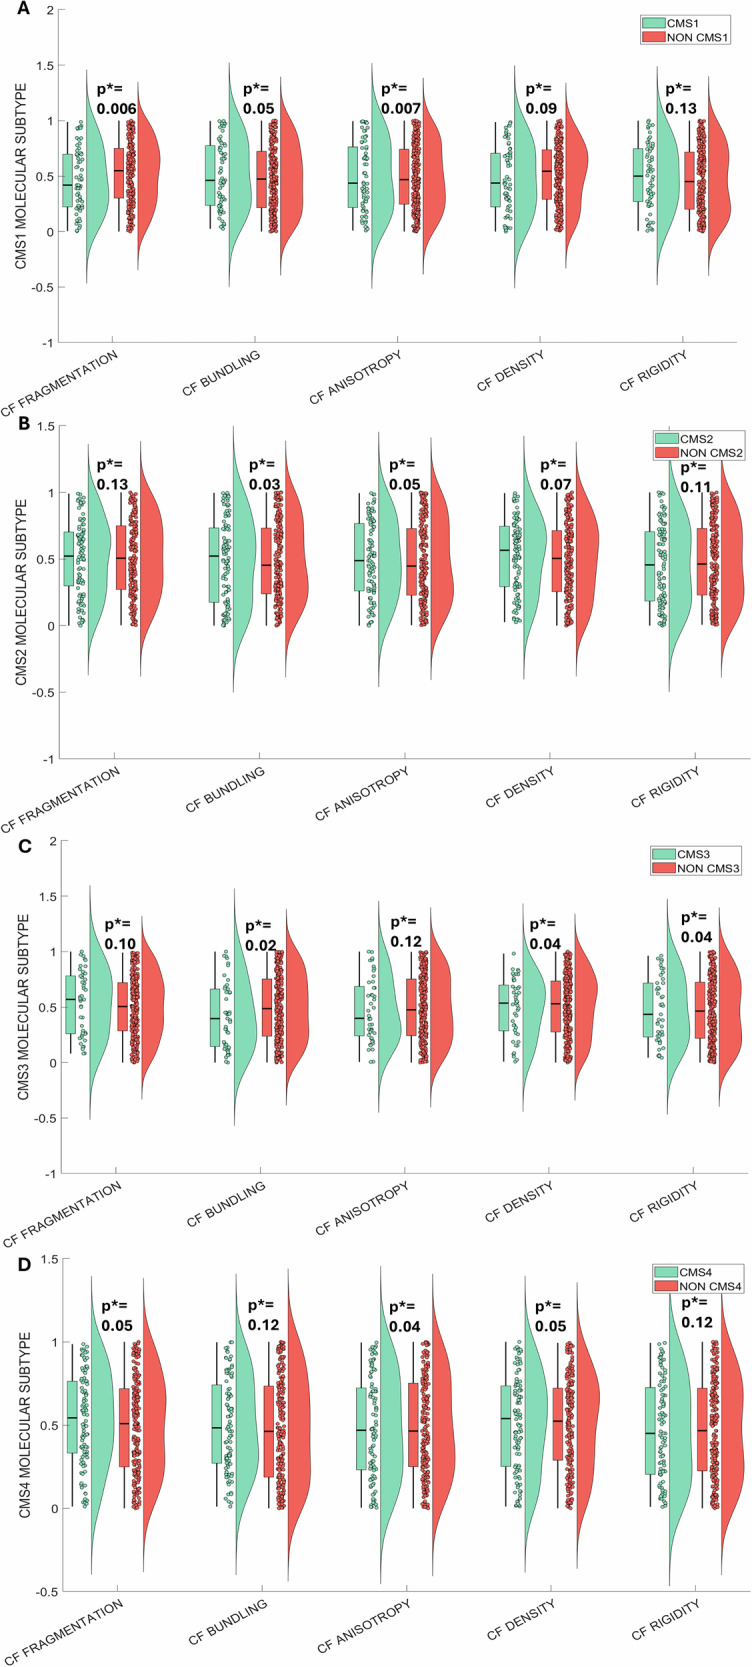
We developed a computational pathology pipeline to extract and analyze collagen disorder architecture (CoDA) features from whole slide images (WSIs) of 2,212 colon cancer (CC) patients across multiple institutions. CoDA features-capturing collagen fragmentation, bundling, anisotropy, density, and rigidity, were evaluated for associations with clinical variables (overall stage, T/N/M stage), molecular classifications (Consensus Molecular Subtypes [CMS1-4]), and genetic mutations (KRAS, BRAF, NRAS) using the Mann-Whitney U test with Bonferroni correction. These analyses revealed significant differences in CoDA feature distributions across multiple subgroups, suggesting that collagen architecture varies meaningfully with tumor stage, molecular subtype, and mutation status.To assess how well CoDA features could distinguish between these subgroups, we implemented a Random Forest classification framework. High mean AUC values (≥0.7) across several variables indicated strong discriminatory performance of CoDA features in separating clinically and biologically distinct groups.For survival analysis, LASSO-Cox models were trained on the PLCO dataset to generate CoDA-based risk scores for overall survival (OS) and disease-free survival (DFS), which were used to stratify patients into high- and low-risk groups in a combined validation dataset (TCGA, UH, and Emory). Kaplan-Meier curves demonstrated significant survival differences across clinical stages, CMS subtypes, and KRAS mutation status. Multivariable Cox proportional hazards models further confirmed the independent prognostic value of CoDA features after adjusting for clinical, molecular, and genetic covariates. These findings highlight that CoDA features are significantly associated with key clinical and molecular characteristics, can distinguish relevant patient subgroups, and offer independent prognostic information, underscoring their potential utility in characterizing the tumor microenvironment and informing risk stratification in CC.


Conflict of interest statement

Competing interests: Dr. Madabhushi is an equity holder at Picture Health, Elucid Bioimaging, and Inspirata Inc. Currently, he serves on the advisory board of Picture Health and SimBioSys. He currently consults Takeda Inc. He also sponsored research agreements with AstraZeneca and Bristol Myers Squibb. His technology has been licensed for Picture Health and Elucid Bioimaging. He is also involved in two different R01 grants from Inspirata, Inc. He also served as a member of the Frederick National Laboratory Advisory Committee. The remaining authors declare no competing interests.

Figures

Fig. 1
Fig. 1. Workflow of CoDA feature extraction and prognostic analysis in colon cancer.
(1) CoDA FEATURE CALCULATION METHDOLOGY: (A) Whole Slide Image (WSI) from colon cancer patient (B) Tumor mask+HistoQC mask overlaid on WSI (C) Tiling of the WSI from the subtracted masked region (D) Example tiles (E) Collagen fibers within the stroma region of exmaple tile detected by a derivative-of-Gaussian (DtG) based model (F) Collagen fiber fragmentation (G) Collagen fiber bundling (H) Collagen fiber rigidity (I) Collagen fiber anisotropy. As the anisotropy values increase, the colormap transitions to green color at the highest end of the scale (corresponding to well aligned or anisotropic orientation). J Collagen fiber density. Hotter colors such as red and yellow represent higher density values while cooler colors such as blue and green represent lower density values in the density scale. K Cropped portion of Collagen fiber fragmentation (L) Cropped portion of Collagen fiber bundling (M) Cropped portion of Collagen fiber rigidity (N) Representation of tumor region tiles with example CoDA feature: Density, restitched back into their corresponding positions within the WSI. (2) STATISTICAL ANALYSIS: (A) Violin plots showing distribution across KRAS,BRAF and NRAS mutational variables for the individual CoDA features i.e., CF Fragmentation, CF Bundling, CF Anisotropy, CF Density and CF Rigidity. Significant differences between the groups (example: KRAS wild type vs KRAS mutated) were calculated by Mann–Whitney U test with Bonferroni corrected p values (*p) reported. Similar tests were done for clinical (Overall Stage, T Stage, N Stage and M Stage) and molecular variables (CMS1-4). Example Kaplan Meier plots showing risk stratified high and low risk groups, as derived using CoDA features using LASSO Cox proportional Hazards Model, for KRAS wild type for (B) Overall Survival (OS) and (C) Disease Free Survival (DFS). Risk stratification was done for other mutational variables (KRAS mutated, BRAF wild type and mutated and NRAS wild type and mutated) alongwith clinical and molecular variables. D To show CoDA as independent prognostic features, Multivariable Cox Proportional Hazards Analysis was done for OS and DFS for clinical, molecular and genetic variables alongwith variables like age, gender and race. Hazard ratios (HR) with corresponding 95% confidence intervals (CI) are presented.
Fig. 2
Fig. 2. Violin plots of CoDA features across clinical subgroups.
Violin plots depict differences in collagen architectural features—CF Fragmentation, CF Bundling, CF Anisotropy, CF Density, and CF Rigidity—across clinical subgroups: (A) Overall Stage (I–II vs. III–IV), (B) T Stage (T1–2 vs. T3–4), (C) N Stage (N0 vs. N + ), and (D) M Stage (M0 vs. M1). Statistical significance was assessed with Bonferroni-adjusted p-values (*p). Significant differences were observed in CF Fragmentation, CF Anisotropy, and CF Rigidity for Overall Stage; CF Anisotropy, CF Density, and CF Rigidity for T Stage; all CoDA features for N Stage; and CF Fragmentation and CF Bundling for M Stage. These findings demonstrate a consistent association between collagen architectural features and clinical staging, highlighting the potential of CoDA features as non-invasive biomarkers of tumor progression and metastatic potential.
Fig. 3
Fig. 3. Violin plots of CoDA features across molecular subgroups.
CoDA feature variations represented by violin plots are compared across molecular subgroups: (A) CMS1 vs. non-CMS1 (CMS2, CMS3, CMS4), (B) CMS2 vs. non-CMS2 (CMS1, CMS3, CMS4), (C) CMS3 vs. non-CMS3 (CMS1, CMS2, CMS4), and (D) CMS4 vs. non-CMS4 (CMS1, CMS2, CMS3). p-values were corrected for multiple testing using the Bonferroni method (*p). Significant differences were found in CF Fragmentation and CF Anisotropy for CMS1; CF Bundling for CMS2; CF Bundling, CF Density, and CF Rigidity for CMS3; and CF Anisotropy for CMS4. These results highlight distinct collagen architectural patterns associated with each CMS subtype, suggesting that CoDA features may reflect underlying biological differences between molecular subtypes of colon cancer.
Fig. 4
Fig. 4. Violin plots of CoDA features across mutational subgroups.
Violin plots demonstrate differences in CoDA features among mutational subgroups defined by KRAS, BRAF, and NRAS mutation status: (A) KRAS wild type vs. mutated, (B) BRAF wild type vs. mutated, and (C) NRAS wild type vs. mutated. Multiple comparison corrections were applied via Bonferroni adjustment (*p). Significant differences were observed across all CoDA features between BRAF wild type and mutated groups. In KRAS, all features except CF Fragmentation differed significantly between wild type and mutant tumors. For NRAS, only CF Rigidity showed a significant difference. These findings suggest that specific collagen structural patterns captured by CoDA features are associated with mutation status, underscoring their potential relevance in characterizing tumor microenvironment differences linked to oncogenic mutations.
Fig. 5
Fig. 5. CoDA-Based Risk Stratification of Overall Survival Across Clinical Subtypes.
Kaplan–Meier (KM) curves showing overall survival (OS) stratified by CoDA-derived risk groups (high vs. low risk) within clinical subtypes: (A) Stage I–II, (B) Stage III–IV, (C) T1–T2, (D) T3–T4, (E) N0, (F) N + , (G) M0, and (H) M + . Significant survival differences were observed between risk groups across all clinical stages, underscoring the prognostic utility of CoDA features irrespective of tumor burden.
Fig. 6
Fig. 6. CoDA-Based Risk Stratification of Disease Free Survival Across Clinical Subtypes.
Kaplan–Meier (KM) plots presenting disease-free survival (DFS) stratified by CoDA-derived risk categories (high vs. low risk) across clinical subtypes: (A) Stage I–II, (B) Stage III–IV, (C) T1–T2, (D) T3–T4, (E) N0, (F) N + , (G) M0, and (H) M + . Notably, significant differences in DFS were detected in all groups except M+ (p = 0.13), highlighting the robust predictive capacity of CoDA features in most clinical settings.
Fig. 7
Fig. 7. CoDA-Based Risk Stratification of Overall Survival Across Molecular Subtypes.
Kaplan–Meier (KM) survival curves for overall survival (OS) stratified by CoDA-derived risk groups (high vs. low risk) within molecular subtypes: (A) CMS1, (B) CMS2, (C) CMS3, and (D) CMS4. Statistically significant OS differences between risk groups were identified across all molecular classifications, demonstrating the broad prognostic relevance of CoDA features.
Fig. 8
Fig. 8. CoDA-Based Risk Stratification of Disease Free Survival Across Molecular Subtypes.
Kaplan–Meier (KM) plots depicting disease-free survival (DFS) stratified by CoDA-derived risk groups (high vs. low risk) across molecular subtypes: (A) CMS1, (B) CMS2, (C) CMS3, and (D) CMS4. Significant DFS stratification was observed for all subtypes except CMS3 (p = 0.09), suggesting effective risk discrimination in most molecular contexts with some limitations for CMS3.
Fig. 9
Fig. 9. CoDA-Based Risk Stratification of Overall Survival Across Mutational Subtypes.
Kaplan–Meier (KM) curves illustrating overall survival (OS) stratified by CoDA-derived risk groups (high vs. low risk) within mutational subtypes: (A) KRAS wild type, (B) KRAS mutated, (C) BRAF wild type, and (D) BRAF mutated. Significant OS differences were observed in all mutational subgroups except BRAF-mutated cases (p = 0.60), indicating a potential reduced prognostic impact of CoDA features in this mutation subset.
Fig. 10
Fig. 10. CoDA-Based Risk Stratification of Disease Free Survival Across Mutational Subtypes.
Kaplan–Meier (KM) plots showing disease-free survival (DFS) stratified by CoDA-derived risk groups (high vs. low risk) across mutational subtypes: (A) KRAS wild type, (B) KRAS mutated, (C) BRAF wild type, (D) BRAF mutated, (E) NRAS wild type, and (F) NRAS mutated. Significant DFS differences between risk groups were identified in all mutational categories except BRAF-mutated (p = 0.10) and NRAS-mutated (p = 0.26) cases, indicating diminished predictive performance of CoDA features for these mutations.
Fig. 11
Fig. 11. CONSORT DIAGRAM showing datasets used in our study and the inclusion and exclusion criteria.
PLCO: (The Prostate, Lung, Colorectal, and Ovarian Cancer Screening Trial), TCGA: (The Cancer Genome Atlas), UH :(University Hospitals), EU (Emory University).

Similar articles

References

    1. Siegel, R. L., Miller, K. D., Wagle, N. S. & Jemal, A. Cancer statistics, 2023. CA Cancer J. Clin.73, 17–48 (2023). - PubMed
    1. Liu, Q., Luo, D., Cai, S., Li, Q. & Li, X. P-TNM staging system for colon cancer: combination of P-stage and AJCC TNM staging system for improving prognostic prediction and clinical management. Cancer Manag. Res.10, 2303–2314 (2018). - PMC - PubMed
    1. Siegel, R. L. et al. Colorectal cancer statistics, 2020. CA Cancer J. Clin.70, 145–164 (2020). - PubMed
    1. White, A., Vernon, S. W., Franzini, L. & Du, X. L. Racial disparities in colorectal cancer survival: to what extent are racial disparities explained by differences in treatment, tumor characteristics, or hospital characteristics?. Cancer116, 4622–4631 (2010). - PMC - PubMed
    1. Hendifar, A. et al. Gender disparities in metastatic colorectal cancer survival. Clin. Cancer Res.15, 6391–6397 (2009). - PMC - PubMed

LinkOut - more resources