Review
. 2025 Aug 29;15(1):127.
doi: 10.1186/s13613-025-01526-z.

Lung electrical impedance tomography during positioning, weaning and chest physiotherapy in mechanically ventilated critically ill patients: a narrative review

Affiliations
Review

Lung electrical impedance tomography during positioning, weaning and chest physiotherapy in mechanically ventilated critically ill patients: a narrative review

Sam Bayat et al. Ann Intensive Care. .

Abstract

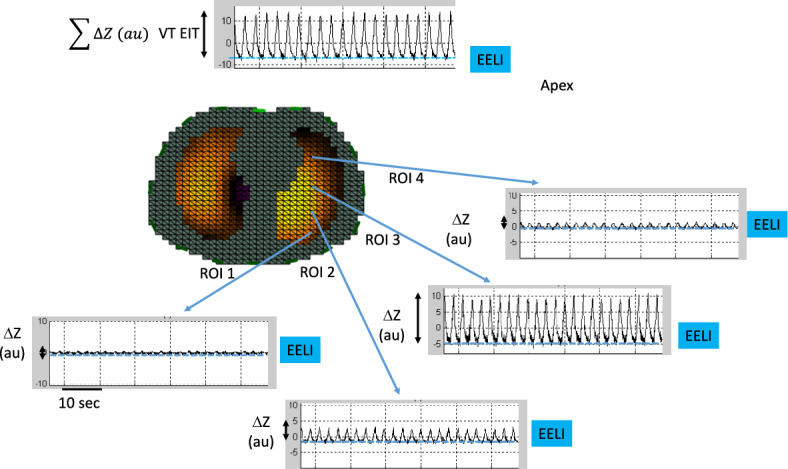
Background: Electrical impedance tomography (EIT) is a non-invasive, radiation free, lung imaging technique of lung ventilation with a low spatial but a high temporal resolution available at the bedside. Lung perfusion, and hence ventilation-to-perfusion ratios, can also be assessed with EIT. Most of the EIT studies in intensive care units (ICU) are dedicated to positive end expiratory pressure selection in patients with acute respiratory distress syndrome receiving invasive mechanical ventilation. This narrative review explores the use of EIT during change in body position, weaning and chest physiotherapy in adult intubated ICU patients.

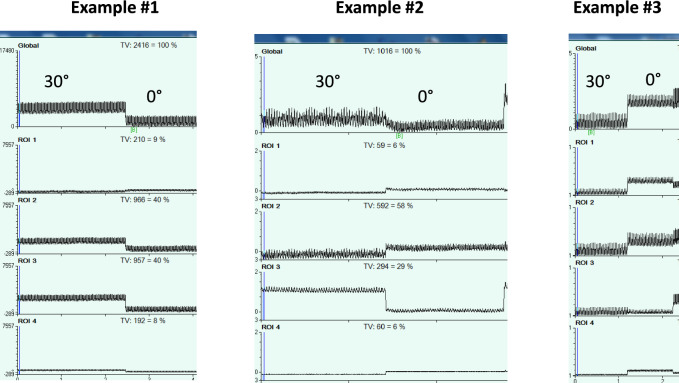
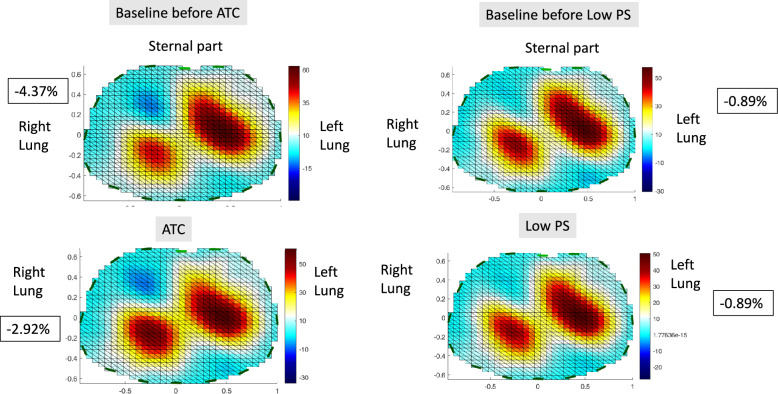
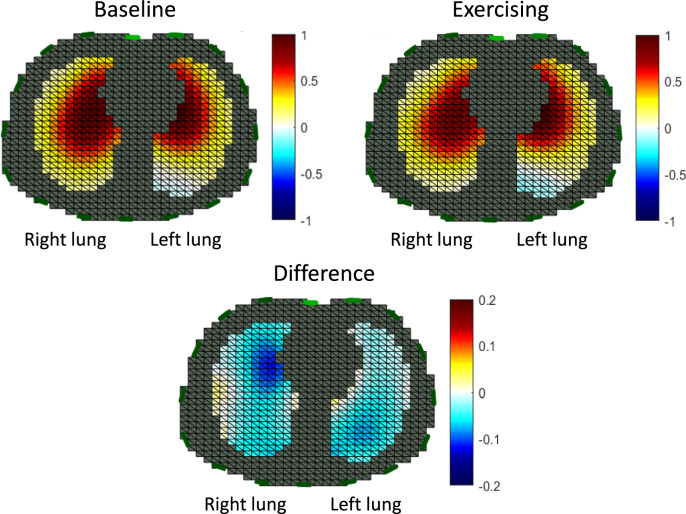
Main body: EIT findings confirm a better ventilation and the persistence of lung perfusion in the dorsal lung regions in prone as compared to supine position. However, the response of the ventilation distribution to prone is heterogeneous across patients. For the weaning, global inhomogeneity index, end-expiratory lung impedance, absolute ventral-to-dorsal difference of the change in lung impedance and temporal skew of aeration had a good performance to predict spontaneous breathing trial (SBT) failure in some observational studies. Pendelluft that measures the risk of overstretching in dependent lung regions can only be assessed with EIT. It occurs frequently during weaning and is associated with poor patient outcome. However, its performance to predict SBT failure was moderate. Randomized controlled trials comparing SBT techniques did not find a difference in EIT indexes. The effects of other body positions and chest physiotherapy have been less investigated with EIT.

Conclusion: EIT offers the possibility to monitor lung ventilation and perfusion at the bedside and hence to deliver a personalized ventilatory management. Further designed EIT studies coupled with measurement of lung aeration and patient breathing effort are warranted during weaning to check if the technique is useful to clinical outcome. The same is true regarding the optimal use of body position including prone, and of chest physiotherapy in ICU patients.

Keywords: Chest physiotherapy; Clearing airways secretion; Electrical impedance tomography; Intensive care unit; Lateral position; Positioning; Prone position; Semi-recumbent position; Weaning.


Conflict of interest statement

Declarations. Ethics approval and consent to participate: Not applicable. Consent for publication: Not applicable. Competing interests: None.

Figures

Fig. 1
Fig. 1
Change in lung impedance (ΔZ) in arbitrary units (au) over time (time scale 10 s) within 4 regions of interest (ROI) arranged as layers Figured out by the blue cubes, in the axial section of the right lung in the supine position. The black double-arrowed vertical lines are the amount of ΔZ in each ROI. The blue broken horizontal lines underline the end expiratory lung impedance (EELI) in each ROI. The tracing on the top is the global ΔZ, which represents the related tidal volume (VT EIT)
Fig. 2
Fig. 2
Unpublished personal data on the effect on impedance changes of changing body inclination from 30° to 0° in supine position in 3 patients with acute respiratory distress syndrome intubated and mechanically ventilated in volume control mode with 6 ml/kg predicted body weight tidal volume, positive end-expiratory pressure of 5 cmH2O, not individualized. The body mass index was 23, 32 and 18 kg/m2, in examples 1, 2 and 3, respectively. In examples #1 and #2 global end-expiratory lung impedance (EELI) went down when inclination moved from 30° to 0°. In example #1 this resulted from the decrease of EELI in all the regions of interest (ROI) but the fourth (most dependent). In example #2 the magnitude of EELI decrease in the ROI 3 was greater than the magnitude of EELI increase in the three other ROIs. In example #3 by contrast, global EELI increased when inclination moved from 30° to 0° as a result of an EELI increase in the ROIs 1 and 2. These findings illustrate why EIT monitoring can be useful to select an optimal angulation of the body in a given patient
Fig. 3
Fig. 3
Lung ventilation assessed by electrical impedance tomography in one patient taken from reference [90] before (baseline) and during either automatic tube compensation (ATC) or pressure support (PS). At baseline, the ventilator was set in PS 12 cmH2O and PEEP 5 cmH2O. ATC was set at 100% inspiratory tube compensation, 0% expiratory tube compensation, positive end-expiratory pressure (PEEP) 4 cmH2O and PS 0 cmH2O. Low PS was set at 7 cmH2O and PEEP 4 cmH2O. The blue color code indicates pendelluft, whose values expressed in percent tidal volume are shown into the black squares. The EIT signals were processed with the EIT reconstruction software EIDORS using a GREIT model [106]
Fig. 4
Fig. 4
Unpublished personal data of the lung ventilation distribution assessed by electrical impedance tomography in an intubated patient under assisted-volume controlled ventilation in two conditions. On the top left panel the patient is resting in the semi-recumbent position in his bed. The top right panel shows distribution of ventilation during the last 2 min after exercising on a cyclo-ergometer for 10 min in the semi-recumbent position in his bed. The bottom panel shows the difference between the two conditions. Between baseline and exercising the antero-posterior distribution of the impedance was 1.26 and 1.48, the center of ventilation 48.2 and 46.5% and the pendelluft (indicated as blue in the color code) − 0.43 and − 2.13% of tidal volume, respectively. The EIT signals were processed with the EIT reconstruction software EIDORS using a GREIT model [106]

References

    1. Piraino T. An introduction to the clinical application and interpretation of electrical impedance tomography. Respir Care. 2022;67:721–9. - PubMed
    1. Frerichs I, Amato MBP, van Kaam AH, Tingay DG, Zhao Z, Grychtol B, et al. Chest electrical impedance tomography examination, data analysis, terminology, clinical use and recommendations: consensus statement of the TRanslational EIT developmeNt stuDy group. Thorax. 2017;72:83–93. - PMC - PubMed
    1. Shi Y, Yang Z, Xie F, Ren S, Xu S. The research progress of electrical impedance tomography for lung monitoring. Front Bioeng Biotechnol. 2021;9: 726652. - PMC - PubMed
    1. Xu M, He H, Long Y. Lung perfusion assessment by bedside electrical impedance tomography in critically Ill patients. Front Physiol. 2021;12: 748724. - PMC - PubMed
    1. Kaczka DW. Imaging the Lung in ARDS: a primer. Respir Care. 2024;69:1011–24. - PMC - PubMed

LinkOut - more resources