. 2025 Aug 28;30(1):102.
doi: 10.1186/s11658-025-00762-2.

Growth differentiation factor 11 attenuates sepsis-associated acute kidney injury by reducing inflammation and coagulation via PGC-1α/Nrf2 activation

Affiliations

Growth differentiation factor 11 attenuates sepsis-associated acute kidney injury by reducing inflammation and coagulation via PGC-1α/Nrf2 activation

Hong-Wei Wang et al. Cell Mol Biol Lett. .

Abstract

Background: Patients with sepsis commonly endure severe renal dysfunction and damage, hastening to end-stage renal failure with high mortality, and effective treatment options are currently lacking. Growth differentiation factor 11 (GDF11), belonging to the transforming growth factor beta (TGF-β) superfamily, has shown therapeutic potential for numerous acute and chronic inflammatory conditions. Nevertheless, its function in sepsis-associated acute kidney injury (SAKI) remains unclear.

Purpose: This study sought to explore GDF11's role in SAKI and determine the signaling pathways it modulates.

Methods: Alterations in GDF11 expression in the kidneys of mice with SAKI were analyzed. The influence of GDF11 knockdown and recombinant GDF11 (rGDF11) supplementation on cecal ligation and puncture (CLP)-induced SAKI in mice was determined. RNA sequencing, Western blot, real-time quantitative polymerase chain reaction (RT-qPCR), and kit assays were performed to explore the underlying mechanisms.

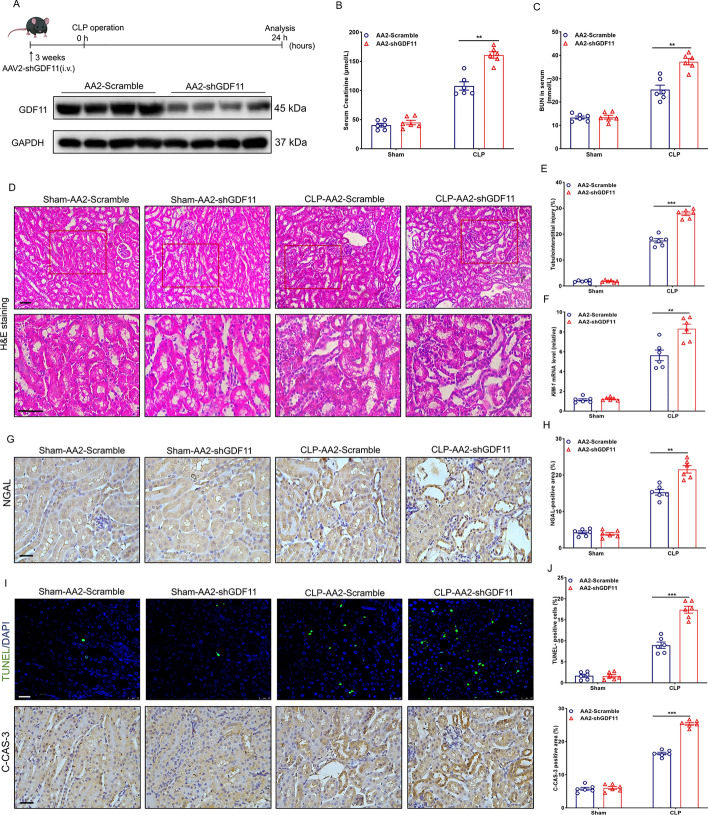
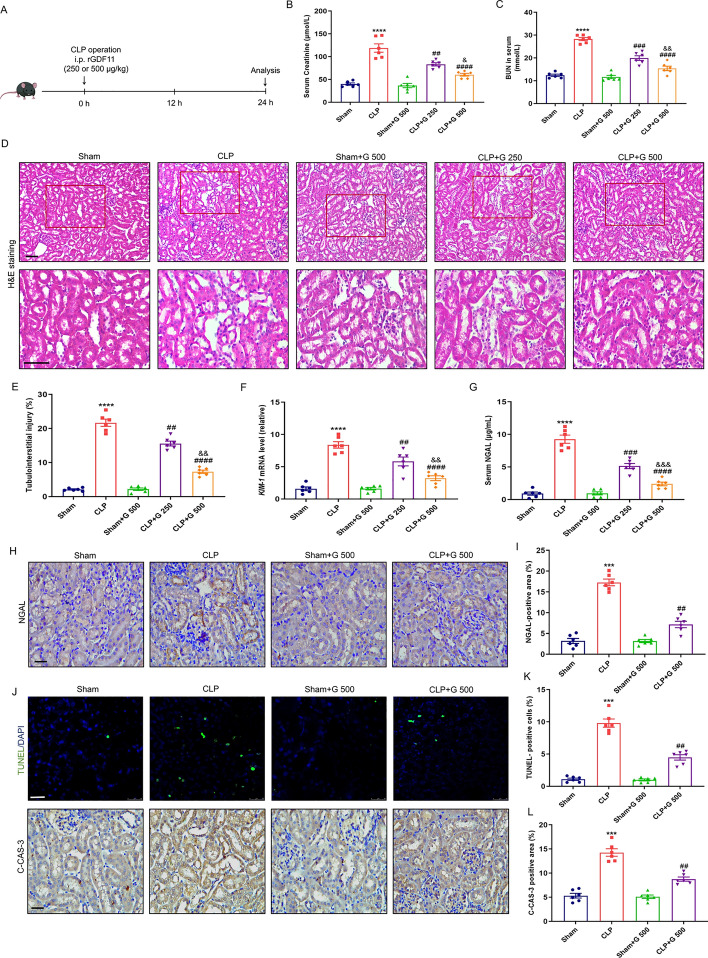
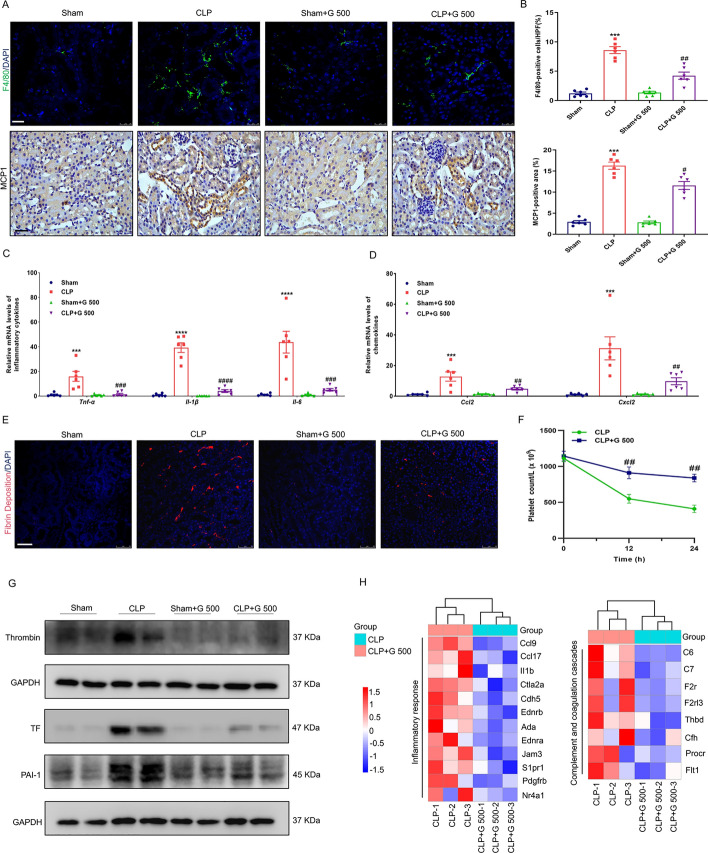
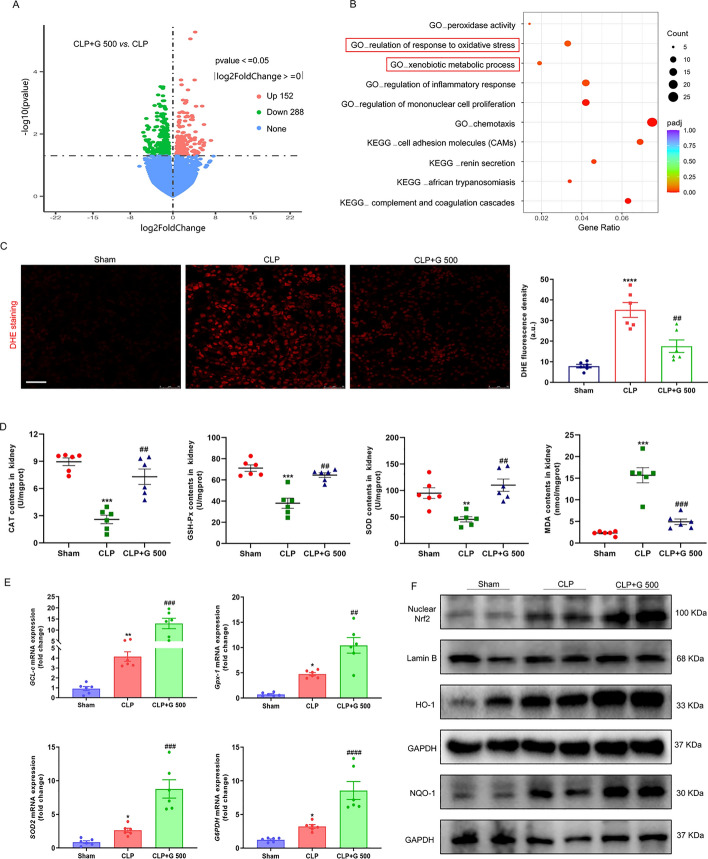
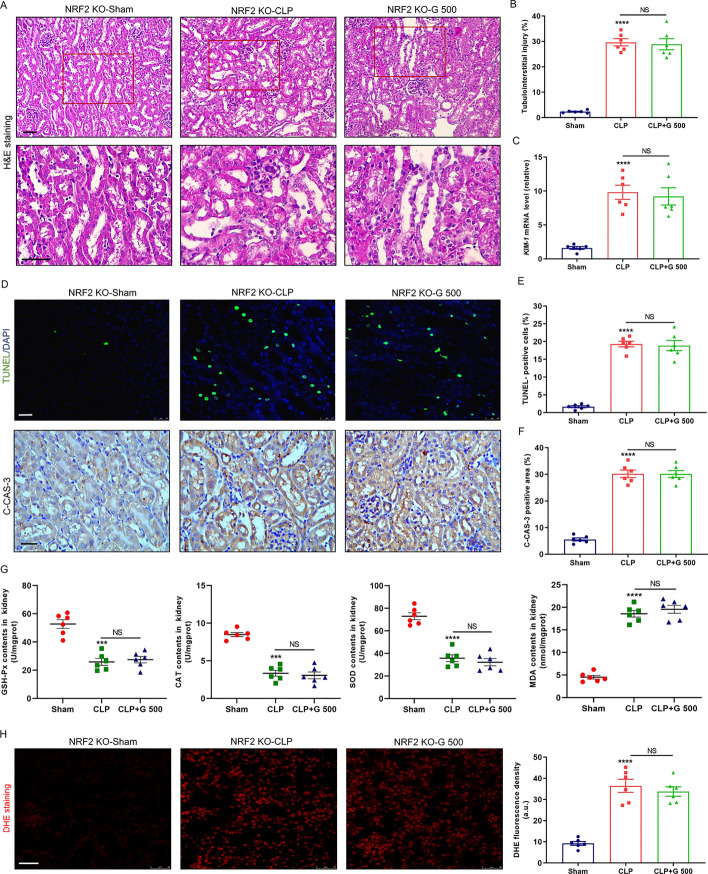
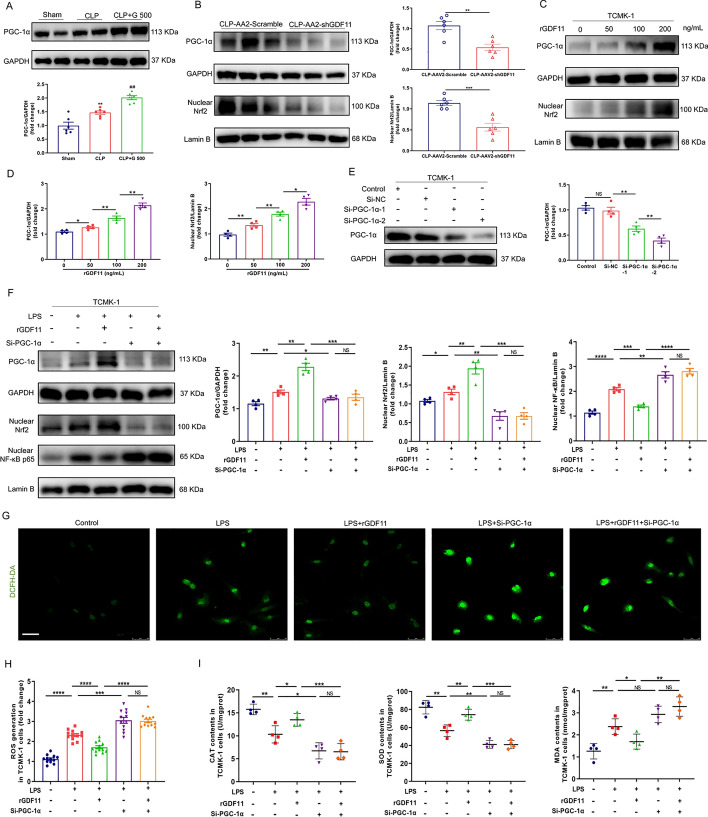
Results: Tubular epithelial cells and macrophages in the kidneys of CLP-induced SAKI mice exhibited high levels of GDF11 expression. Moreover, gene silencing of GDF11 using adeno-associated virus (AAV) aggravated renal dysfunction, increased tubular damage, and augmented renal apoptosis in CLP-induced SAKI mice. In contrast, replenishment of rGDF11 significantly mitigated these adverse effects. Further studies indicated that GDF11 stimulated the nuclear factor erythroid 2-related factor 2 (Nrf2)-regulated antioxidative pathways, primarily by inducing the expression of Peroxisome proliferator-activated receptor-γ coactivator-1α (PGC-1α), which subsequently decreased excessive inflammation and coagulation. Additionally, these beneficial effects of GDF11 were largely diminished by AAV-mediated PGC-1α knockdown and depletion of Nrf2 in CLP-induced SAKI mice.

Conclusions: In summary, these findings indicate that GDF11 is a potential therapeutic approach for SAKI and highlight the crucial role of PGC-1α/Nrf2 signaling in GDF11-mediated renal protection during SAKI.

Keywords: Antioxidation; Coagulation; Inflammation; Nrf2; Sepsis-associated acute kidney injury.


Conflict of interest statement

Declarations. Ethics approval and consent to participate: Animal experiments were approved and reviewed by the Laboratory Animal Ethics Committee of the First Affiliated Hospital of Wenzhou Medical University (approval no. WYYY-AEC-2022-0420, 10 August 2022). The Laboratory Animal Ethics Committee of the First Affiliated Hospital of Wenzhou Medical University adheres to the principles and guidelines set forth by the International Council for Laboratory Animal Science (ICLAS), ensuring that our animal research meets international ethical standards. Consent for publication: The authors declare that they have no competing interests. All authors agree with the publication of this article. Competing interests: The authors have declared no conflicts of interest.

Figures

Fig. 1
Fig. 1
GDF11 is significantly elevated in the CLP-induced SAKI mice. Male C57BL/6J mice were treated with CLP surgery or a sham operation as controls for 24 h. A Representative H&E staining (scale bar = 100 μm) and TUNEL staining (scale bar = 25 μm) images of kidney sections. B The percentage of tubulointerstitial injury area obtained from H&E staining was quantified by ImageJ. C The percentage of positive cells for TUNEL staining was quantified using ImageJ. D, E Renal function was measured by serum CRE and BUN levels. F GDF11 mRNA expression in kidney tissue was evaluated through RT-qPCR analysis, with the values being normalized to β-actin. G Renal GDF11 expression changes were assessed through Western blot, with densitometric quantification carried out using ImageJ. GAPDH served as the loading control. H Representative IHC staining images of GDF11 in the kidneys of mice (scale bar = 50 μm), and GDF11 protein expression was quantified using the mean integrated optical density (IOD)/area measured with Image-Pro Plus 6.0 software. The black arrows indicate GDF11 positive area. I, J Representative IF staining images of GDF11 were observed in the renal tissue of mice (scale bar = 25 μm), and the fluorescence intensity was quantified by ImageJ software. The white arrows indicate the corresponding renal tubular and glomerular areas. K Protein expression levels of GDF11 in TCMK-1 cells were assessed through Western blot following either control or LPS stimulation for 12 h. GAPDH was used as the internal control, and densitometry analysis was performed using ImageJ software for quantification, n = 4 independent experiments. Quantitative data are presented as mean ± SD; n = 6 mice for each group; **p < 0.01, ***p < 0.001, ****p < 0.0001
Fig. 2
Fig. 2
Knocking down GDF11 exacerbates renal dysfunction and damage in mice following CLP operation. Male C57BL/6J mice were subjected to CLP surgery or a sham operation for 24 h after treated with AAV2-Scramble/AA2-shGDF11 via tail vein injection 3 weeks later. A The schematic diagram illustrates the experimental setup, and Western blotting was used to confirm the knockdown efficiency of GDF11 in the kidneys. B, C Levels of serum CRE and BUN were measured as indicators of renal function. D, E Representative H&E staining (scale bar = 100 μm) images of kidney sections and the percentage of tubulointerstitial injury area was measured using ImageJ. F RT-qPCR analysis was performed to assess KIM-1 mRNA expression in kidney tissue, with the values being normalized to β-actin. G, H Representative IHC staining images of NGAL in the kidneys of mice (scale bar = 50 μm) and the NGAL positive area was quantified using Image-Pro Plus 6.0 software. I TUNEL staining (scale bar = 25 μm) and c-CAS-3 IHC staining (scale bar = 50 μm) were performed on kidney sections. J The percentage of positive cells for TUNEL staining was quantified using ImageJ, and the c-CAS-3 positive area was quantified using Image-Pro Plus 6.0 software. Quantitative data are presented as mean ± SD; n = 6 mice for each group; **p < 0.01, ***p < 0.001
Fig. 3
Fig. 3
Treatment with rGDF11 attenuates renal dysfunction and damage in CLP-induced SAKI mice. After CLP surgery, male C57BL/6J mice were immediately treated with rGDF11 via intraperitoneal injection at doses of 250 μg/kg or 500 μg/kg. The mice were then sacrificed 24 h later for analysis. A Schematic diagram of the work. B, C Serum CRE and BUN levels were measured to assess renal function. D, E Kidney sections were stained with H&E (scale bar = 100 μm), and the percentage of tubulointerstitial injury area was calculated using ImageJ. F KIM-1 mRNA expression in kidney tissue was analyzed by RT-qPCR and normalized to β-actin. G Serum NGAL levels were measured using ELISA. H, I Representative IHC staining images of NGAL in the kidneys of mice (scale bar = 50 μm), with quantification of the NGAL positive area conducted using Image-Pro Plus 6.0 software. J TUNEL staining (scale bar = 25 μm) and c-CAS-3 IHC staining (scale bar = 50 μm) were performed on kidney sections to assess apoptosis. KL The percentage of TUNEL-positive cells and the c-CAS-3 positive area were quantified using ImageJ and Image-Pro Plus 6.0 software, respectively. Quantitative data are presented as mean ± SD; n = 6 mice for each group; ***p < 0.001, ****p < 0.0001 versus the sham group, ##p < 0.01, ###p < 0.001, ####p < 0.0001 versus the CLP group, &p < 0.05, &&p < 0.01, &&&p < 0.001 versus the CLP + G250 group
Fig. 4
Fig. 4
Administration of rGDF11 in CLP-induced SAKI mice results in reduced renal inflammation and coagulation. Once the CLP surgery was completed, male C57BL/6 J mice were immediately given rGDF11 via intraperitoneal injection at a dose of 500 μg/kg. They were then sacrificed 24 h later for analysis. A The expression of F4/80 (scale bar = 10 μm) and MCP-1 (scale bar = 50 μm) in the kidneys was examined using IF and IHC staining, respectively (n = 6 mice/group). B The percentage of F4/80 positive cells and the MCP-1 positive area were quantified using ImageJ and Image-Pro Plus 6.0 software, respectively (n = 6 mice/group). C, D The mRNA levels of proinflammatory cytokines (TNF-α, IL-1β and IL-6) and chemokines (Ccl2 and Cxcl2) in the kidneys of mice were measured by RT-qPCR (n = 6 mice/group). E Fibrin deposition was assessed by IF staining of kidney sections (scale bar = 50 μm) (n = 6 mice/group). F Platelet count in the blood of mice (n = 6 mice/group). G The protein expressions of thrombin, TF, and PAI-1 were measured by Western blot in the kidney tissue of mice, with GAPDH as the loading control (n = 6 mice/group). H RNA-seq analysis of kidneys from CLP mice and rGDF11-treated mice was performed, with upregulated genes shown in red and downregulated genes in blue (n = 3 mice/group). Quantitative data are presented as mean ± SD; ***p < 0.001, ****p < 0.0001 versus the sham group, #p < 0.05, ##p < 0.01, ###p < 0.001, ####p < 0.0001 versus the CLP group
Fig. 5
Fig. 5
rGDF11 improves CLP-induced renal oxidative stress probably by activating Nrf2-mediated antioxidant activity. Male C57BL/6J mice were promptly administered rGDF11 through intraperitoneal injection at a dose of 500 μg/kg after the completion of the CLP surgery. They were subsequently euthanized for analysis 24 h post-injection. A The volcano plots show the significantly upregulated (red) and downregulated (green) genes between CLP mice and rGDF11-treated mice (n = 3 mice/group). B GO and KEGG analysis of the significantly differentially expressed genes between CLP mice and rGDF11-treated mice (n = 3 mice/group). C ROS levels were assessed by DHE staining in each experimental group (scale bar = 50 μm), with fluorescence intensity analyzed using ImageJ software (n = 6 mice/group). D Levels of CAT, GSH-Px, SOD, and MDA in kidney tissue were measured (n = 6 mice/group). E The mRNA expression of antioxidant genes GCL-c, Gpx-1, SOD2, and G6PDH in kidney tissue was determined by RT-qPCR and normalized to β-actin (n = 6 mice/group). F Protein expression levels of Nrf2 signaling components (nuclear Nrf2, HO-1, and NQO-1) in kidney tissue were analyzed by Western blot, with GAPDH as the loading control for total proteins and Lamin B as the internal control for nuclear fractions (n = 6 mice/group). Quantitative data are presented as mean ± SD; *p < 0.05, **p < 0.01, ***p < 0.001, ****p < 0.0001 versus the sham group, ##p < 0.01, ###p < 0.001, ####p < 0.0001 versus the CLP group
Fig. 6
Fig. 6
Absence of Nrf2 abolishes the protective effects of rGDF11 against renal dysfunction and damage in CLP-induced SAKI. After being subjected to either CLP surgery or a sham operation for a period of 24 h, Nrf2 KO mice were euthanized for examination post-rGDF11 injection. A, B Histopathological changes in the kidneys of each experimental group were observed through H&E staining (scale bar = 100 μm), and the percentage of tubulointerstitial injury area was calculated using ImageJ. C KIM-1 mRNA expression in kidney tissue was analyzed by RT-qPCR and normalized to β-actin. D Representative TUNEL staining (scale bar = 25 μm) and c-CAS-3 IHC staining (scale bar = 50 μm) of kidney sections from mice in each experimental group. E, F The percentage of TUNEL-positive cells and c-CAS-3-positive area were quantified using ImageJ and Image-Pro Plus 6.0 software, respectively. G The contents of GSH-Px, CAT, SOD, and MDA in the kidney tissue of mice. H Renal ROS production was assessed through DHE staining (scale bar = 50 μm), and the DHE fluorescence density was analyzed using ImageJ software. All values are presented as mean ± SD; n = 6 for each group; ***p < 0.001, ****p < 0.0001 versus the sham group; NS, not significant
Fig. 7
Fig. 7
rGDF11-mediated Nrf2 activation is undercontrolled by PGC-1α. A Western blot was used to detect the impact of rGDF11 treatment on the renal expression of PGC-1α in CLP-induced SAKI mice. The densitometry of the results was quantified using ImageJ software, with GAPDH serving as the loading control (n = 6 mice/group). B The effect of GDF11 knockdown on the renal expression of PGC-1α in CLP-induced SAKI mice were detected by Western blot and quantified by densitometry using ImageJ software (n = 6 mice/group). GAPDH was used as the loading control. C, D The levels of protein expression of PGC-1α and Nrf2 were measured in cultured TCMK-1 cells treated with different concentrations of rGDF11 (0, 50, 100, and 200 ng/mL) for 12 h using Western blot (n = 4 independent experiments). The densitometry of the bands was quantified using ImageJ software, with GAPDH used as the loading control for total proteins and Lamin B as the internal control for nuclear fractions. E The knockdown efficiency of siPGC-1α in TCMK-1s was confirmed by Western blot assays and quantified by densitometry using ImageJ software (n = 4 independent experiments). GAPDH was used as the loading control. F The protein expression levels of PGC-1α, Nrf2, and NF-κB p65 were detected by Western blot in LPS-challenged TCMK-1s treated with rGDF11 for 12 h with or without transfected PGC-1α siRNA. Quantitative analysis of these indicators was performed using ImageJ software (n = 4 independent experiments). GAPDH was used as the loading control for total proteins and Lamin B was used as the internal control for nuclear fractions. G, H Measurement of intracellular ROS in TCMK-1s with DCFH-DA staining (scale bar = 50 μm), and the fluorescence intensity was quantified by ImageJ software (n = 4 sections from four independent experiments, three images per section). I CAT, SOD, and MDA concentrations in TCMK-1 s of each group (n = 4 independent experiments). Quantitative data are presented as mean ± SD; **p < 0.01 versus the sham group and ##p < 0.01 versus the CLP group for Fig. 8A; *p < 0.05, **p < 0.01, ***p < 0.001, ****p < 0.0001; NS, not significant
Fig. 8
Fig. 8
rGDF11 inhibits the increase in inflammatory mediators and coagulation factors in LPS-stimulated macrophages through enhancement of PGC-1α/Nrf2 signaling. A The knockdown efficiency of siPGC-1α in Raw264.7 macrophages was confirmed through Western blot assays and quantified using ImageJ software. GAPDH was used as the loading control. BD Protein expression levels of PGC-1α, Nrf2, and NF-κB p65 were measured by Western blot in LPS-challenged Raw264.7 macrophages treated with rGDF11 for 12 h with or without transfected PGC-1α siRNA. Quantitative analysis was performed using ImageJ software. GAPDH was used as the loading control for total proteins, and Lamin B was used as the internal control for nuclear fractions. E MDA concentrations in Raw264.7 macrophages were measured in each group. F, G Intracellular ROS levels were assessed in Raw264.7 macrophages using DCFH-DA staining (scale bar = 50 μm), and fluorescence intensity was quantified with ImageJ software (n = 4 sections from four independent experiments, three images per section). H CAT and SOD concentrations in Raw264.7 macrophages were measured in each group. I TNF-α concentrations in the culture medium of Raw264.7 macrophages were determined for each group. J, K TF generation was evaluated through IF staining in Raw264.7 macrophages of each group (scale bar = 10 μm), and fluorescence intensity was quantified using ImageJ software (n = 4 sections from four independent experiments, three images per section). L TF concentrations in the culture medium of Raw264.7 macrophages were measured for each group. M The mRNA levels of TF and PAI-1 in Raw264.7 macrophages of each group were analyzed through RT-qPCR and normalized to β-actin. Quantitative data are presented as mean ± SD; n = 4 independent experiments; *p < 0.05, **p < 0.01, ***p < 0.001, ****p < 0.0001; NS, not significant
Fig. 9
Fig. 9
PGC-1α provides protective benefits of rGDF11 against CLP-induced SAKI. Male C57BL/6J mice were administered AAV2-shNC or AAV2-shPGC-1α via tail vein injection for 3 weeks, followed by either CLP surgery or a sham operation for 24 h, with or without rGDF11 supplementation. A Representative Western blot images showing the levels of renal PGC-1α, Nrf2, HO-1, and NQO-1, with quantification performed using ImageJ software. GAPDH was used as the loading control. B Representative pathological images of kidney sections stained with H&E under a light microscope (scale bar = 100 μm), with the percentage of tubulointerstitial injury area calculated using ImageJ. C Analysis of KIM-1 mRNA expression in kidney tissue by RT-qPCR, normalized to β-actin. D TUNEL staining (scale bar = 25 μm) and c-CAS-3 IHC staining (scale bar = 50 μm) on kidney sections to assess apoptosis, with quantification of TUNEL-positive cells and c-CAS-3-positive area using ImageJ and Image-Pro Plus 6.0 software, respectively. E Measurement of CAT, GSH-Px, SOD, and MDA levels in kidney tissue. F Representative images of DHE staining of kidney sections in mice, with analysis of DHE fluorescence density using ImageJ software. Quantitative data are presented as mean ± SD; n = 6 mice for each group; *p < 0.05, **p < 0.01, ***p < 0.001 versus the CLP + AAV2-sh-NC group, ###p < 0.001, ####p < 0.0001 versus the CLP + G500 + AAV2-sh -NC group

Similar articles

References

    1. Cecconi M, Evans L, Levy M, Rhodes A. Sepsis and septic shock. Lancet. 2018;392(10141):75–87. - PubMed
    1. Rudd KE, Johnson SC, Agesa KM, Shackelford KA, Tsoi D, Kievlan DR, et al. Global, regional, and national sepsis incidence and mortality, 1990–2017: analysis for the Global Burden of Disease Study. Lancet. 2020;395(10219):200–11. - PMC - PubMed
    1. Skube SJ, Katz SA, Chipman JG, Tignanelli CJ. Acute kidney injury and sepsis. Surg Infect (Larchmt). 2018;19(2):216–24. - PubMed
    1. Peerapornratana S, Manrique-Caballero CL, Gómez H, Kellum JA. Acute kidney injury from sepsis: current concepts, epidemiology, pathophysiology, prevention and treatment. Kidney Int. 2019;96(5):1083–99. - PMC - PubMed
    1. White KC, Serpa-Neto A, Hurford R, Clement P, Laupland KB, See E, et al. Sepsis-associated acute kidney injury in the intensive care unit: incidence, patient characteristics, timing, trajectory, treatment, and associated outcomes. A multicenter, observational study. Intensive Care Med. 2023;49(9):1079–89. - PMC - PubMed

MeSH terms

Substances