

randPedPCA: rapid approximation of principal components from large pedigrees
- PMID: 40877802
- PMCID: PMC12392600
- DOI: 10.1186/s12711-025-00994-y
randPedPCA: rapid approximation of principal components from large pedigrees
Abstract
Background: Pedigrees continue to be extremely important in agriculture and conservation genetics, with the pedigrees of modern breeding programmes easily comprising millions of records. This size can make visualising the structure of such pedigrees challenging. Being graphs, pedigrees can be represented as matrices, including, most commonly, the additive (numerator) relationship matrix, , and its inverse. With these matrices, the structure of pedigrees can then, in principle, be visualised via principal component analysis (PCA). However, the naive PCA of matrices for large pedigrees is challenging due to computational and memory constraints. Furthermore, computing a few leading principal components is usually sufficient for visualising the structure of a pedigree.
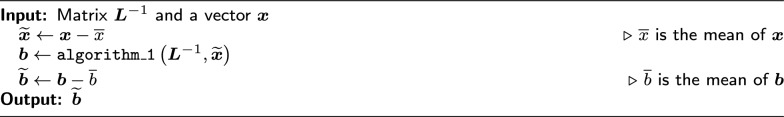
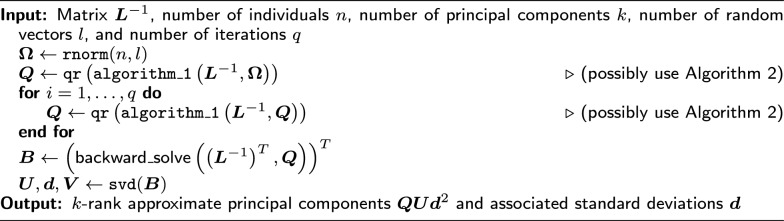
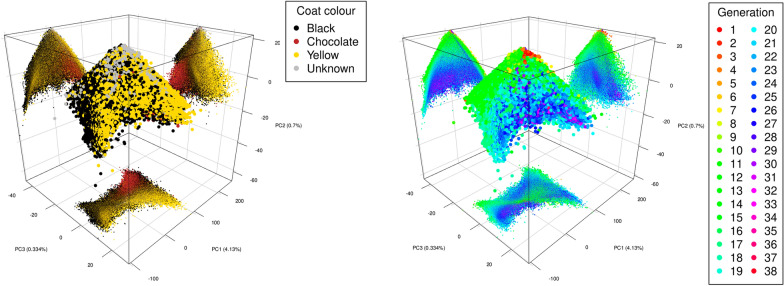
Results: We present the open-access R package randPedPCA for rapid pedigree PCA using sparse matrices. Our rapid pedigree PCA builds on the fact that matrix-vector multiplications with the additive relationship matrix can be carried out implicitly using the extremely sparse inverse relationship factor, , which can be directly obtained from a given pedigree. We implemented two methods. Randomised singular value decomposition tends to be faster when very few principal components are requested, and Eigen decomposition via the RSpectra library tends to be faster when more principal components are of interest. On simulated data, our package delivers a speed-up greater than 10,000 times compared to naive PCA. It further enables analyses that are impossible with naive PCA. When only two principal components are desired, the randomised PCA method can half the running time required compared to RSpectra, which we demonstrate by analysing the pedigree of the UK Kennel Club registered Labrador Retriever population of almost 1.5 million individuals.
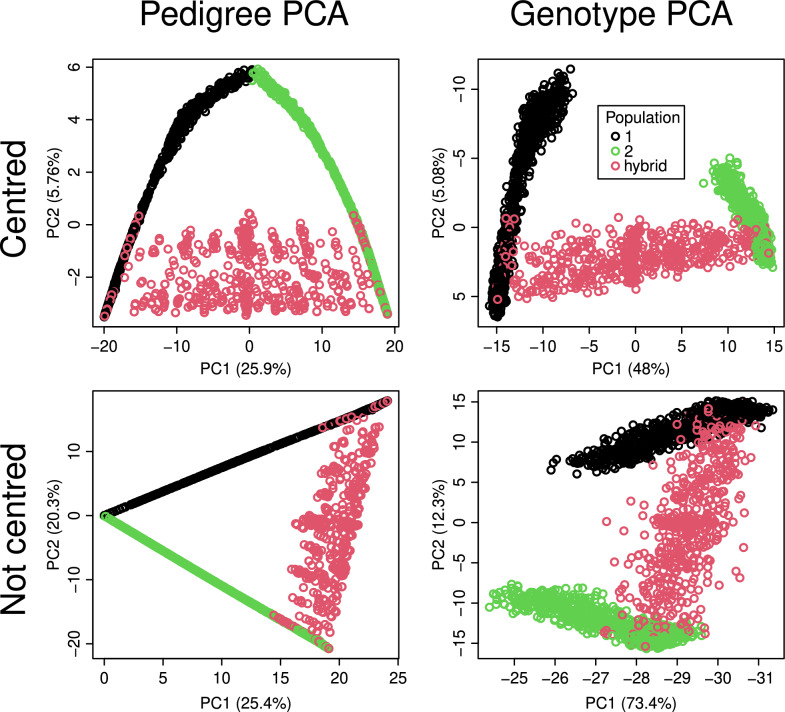
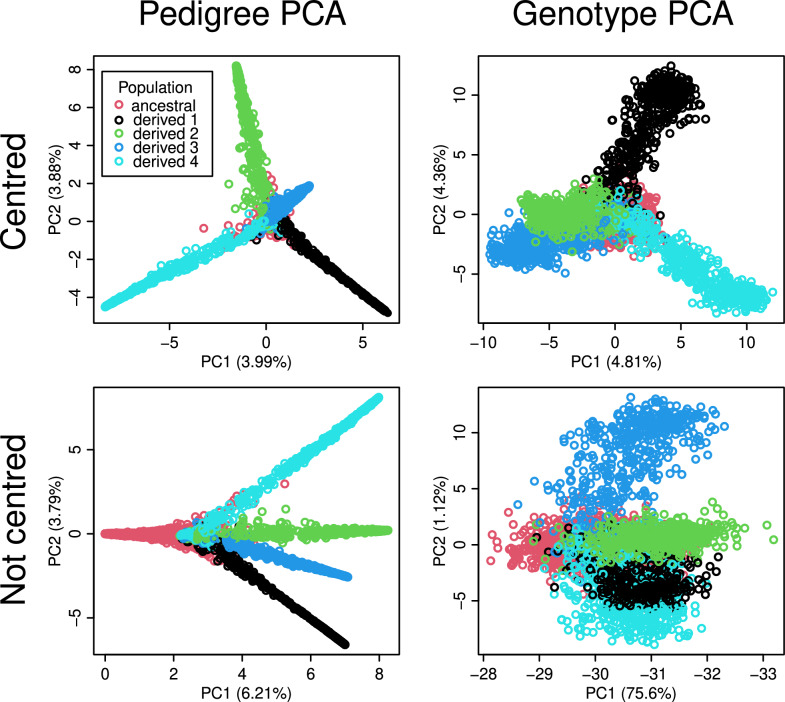
Conclusions: The leading principal components of pedigree matrices can be efficiently obtained using randomised singular value decomposition and other methods. Scatter plots of these scores allow for intuitive visualisation of large pedigrees. For large pedigrees, this is considerably faster than rendering plots of a pedigree graph.
© 2025. The Author(s).
Conflict of interest statement
Declarations. Ethics approval and consent to participate: Does not apply. Consent for publication: Does not apply. Competing interests: The authors declare that they have no competing interests.
Figures

References
-
- Garbe JR, Da Y. A software tool for the graphical visualization of large and complex populations. Acta Genet Sin. 2003;30(12):1193–5. - PubMed
-
- Kepner J, Gilbert J. Graph algorithms in the language of linear algebra. Philadelphia: Society for Industrial and Applied Mathematics; 2011. p. 389. 10.5555/2039367.
-
- Lauritzen SL. Graphical models. Oxford statistical science series. Clarendon Press; 1996. p. 308.
-
- Pearson K. On lines and planes of closest fit to systems of points in space. London Edinburgh Dublin Philos Mag J Sci. 1901;2(11):559–72. 10.1080/14786440109462720. - DOI
-
- Hotelling H. Analysis of a complex of statistical variables into principal components. J Educ Psychol. 1933;24(6):417–41. 10.1037/h0071325. - DOI
MeSH terms
Grants and funding
LinkOut - more resources
Full Text Sources
