. 2025 Aug 28;20(1):94.
doi: 10.1186/s13024-025-00887-0.

MS4A6A/Ms4a6d deficiency disrupts neuroprotective microglia functions and promotes inflammation in Alzheimer's disease model

Affiliations

MS4A6A/Ms4a6d deficiency disrupts neuroprotective microglia functions and promotes inflammation in Alzheimer's disease model

Hai-Shan Jiao et al. Mol Neurodegener. .

Abstract

Background: Alzheimer's disease (AD) is the most common type of dementia. Genetic polymorphisms are associated with altered risks of AD onset, pointing to biological processes and potential targets for interventions. Consistent with the important roles of microglia in AD development, genetic mutations of several genes expressed on microglia have been identified as risks for AD. Emerging evidences indicate that the expression of a microglia-specific gene MS4A6A is thought to be associated with AD, since AD patients show upregulation of MS4A6A, and its levels correlate with the severity of clinical neuropathology. However, the mechanism linking MS4A6A and AD has not been experimentally studied.

Methods: We performed a meta genome-wide association analysis with 734,121 subjects to examine the associations between polymorphisms of MS4A6A with AD risks. In addition, we analyzed the correlation between MS4A6A and AD-related cerebrospinal fluid biomarkers from our own cohort. Furthermore, we for the first time generated a Ms4a6d deficient APP/PS1 model, and systematically examined pathological changes using high-resolution microscopy, biochemistry, and behavioral analysis.

Results: We identified several new mutations of MS4A6A with altered AD risks, and discovered specific correlation for some of them with the amount of β-amyloid in cerebrospinal fluid. Protective variant of MS4A6A is associated with elevated expression of the gene. Deficient Ms4a6d led to reduced amyloid clearance in the brain. Immunostaining from postmortem AD patients brain revealed selective expression of MS4A6A in microglia. In APP/PS1 mice lacking Ms4a6d, microglia showed markedly diminished envelopment and phagocytosis of amyloid, leading to increased plaque burden, less compact structure, and more severe synaptic damage. Importantly, Ms4a6d deficiency markedly exacerbated inflammatory responses in both microglia and astrocytes by disinhibiting NF-κB signaling. Overexpressing MS4A6A in human microglia cell line promoted gene expression related to plaque-associated responses and diminished inflammation signatures.

Conclusions: Our findings reveal that Ms4a6d deficiency suppresses neuroprotection and worsens neuroinflammation. Sufficient Ms4a6d maybe beneficial for boosting amyloid-related responses and suppressing inflammation in microglia, making it superior than previously reported candidates for microglia modulation. Thus, the elevated MS4A6A levels in AD are likely compensatory and boosting MS4A6A could be an effective treatment.

Keywords: Alzheimer’s disease; MS4A6A; Microglia; Ms4a6d; Neuroinflammation.


Conflict of interest statement

Declarations. Ethics approval and consent to participate: The CABLE study was carried out following the Declaration of Helsinki and the Qingdao Municipal Hospital's Institutional Ethics Committees approved the study's protocol. The current analyses were conducted under UK Biobank application number 19542. All of the experiments comply with the animal study protocol approved by the Fudan University. The consent for human body and organ donation (code number: 00303) was carefully signed by the donor. Consent for publication: Not applicable. Competing interests: The authors declare that they have no competing interests.

Figures
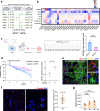
Fig. 1
Fig. 1
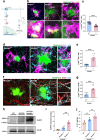
Human MS4A6A SNPs are correlated with AD risks and amyloid biomarkers in the CSF. a Meta-analysis of the genome-wide associations between MS4A6A SNPs and risks of AD. Three cohorts were included: UK Biobank, Kunkle Stage 1 and FinnGen consortium. Error bars indicate the upper and lower boundaries of confidence interval. A1 indicates the effect alleles with the frequencies listed under effect allele frequency (EAF). A2 shows the control alleles. Generalized linear regression models were used for statistical comparisons. b Heatmap of association between MS4A6A SNPs and neuropathological biomarkers in CSF. Generalized linear regression models were used for statistical comparisons. Significance is shown on the image: blank, P > 0.05, *, P < 0.05, ***, P < 0.001, ****, P < 0.0001. c Left: Workflow diagram of rs646924: T > C (A > G) editing via single-base editing in HMC3 cells followed by monoclonal cell line isolation. Middle: Validation of rs646924: T > C editing by Sanger sequencing in monoclonal derivatives. Right: qPCR analysis of MS4A6A expression at the rs646924: G locus versus controls rs646924: A (normalized as 1). Two-tail unpaired student’s t-test was used. ****, P < 0.0001. N = 3 repeated experiments. d ISF Aβ1-x obtained by microdialysis from 1-month-old APP/PS1:Ms4a6d +/+ mice (blue) and APP/PS1:Ms4a6d +/− mice (magenta). Baseline Aβ1-x levels were defined as the mean concentration from hours 3–5 after probe insertion. Aβ1-x values after γ-secretase inhibitor Compound E treatment at each time point were expressed as percentage of baseline mean (% baseline). Raw data were fitted with linear trend lines. Two-tail unpaired student’s t-test was used. *, P < 0.05. N = 3 mice for each group. e Left panels show representative confocal images of MS4A6A (yellow) co-stained for IBA1 (red, for microglia) and GFAP (green, for astrocytes) in human brain tissues. Right panels show zoomed microglia and astrocyte images from the boxes in the left. Scale bar: 20 µm. f Representative RNA-scope images and quantification of RNA transcripts of MS4A6A (red) and microglia marker Aif1 (yellow). Nuclei were stained with DAPI. Right panel shows the quantification of Ms4a6d-positive microglia in total Ms4a6d -positive cells. Left panel scale bar: 50 µm. Middle panel scale bar: 10 µm. N = 3 mice. g Quantifications of Ms4a6d expression level in wild type mice at 2-month, 6-month and 12-month based on stereo-seq data. One-way ANOVA tests with post hoc Tukey tests were used. ****, P < 0.0001. a.u., arbitrary unit. N = 6 mice
Fig. 2
Fig. 2
Ms4a6d deletion diminishes microglial responses to Aβ pathology in APP/PS1 mice. a Representative confocal images of Iba1-positive microglia (magenta) enveloping the Thioflavin S-positive amyloid plaques (green) in APP/PS1 mice with different Ms4a6d genotypes. b Quantification of microglia coverage, normalized by 360°. Statistical comparisons were calculated with analysis by individual plaques (left) or by mice (right). Dots in the right panel indicate data from individual animal. c Quantification of the Iba1 immuno-staining fluorescent intensities in the near-plaque processes normalized by intensities in the whole cell. d Representative zoomed images of microglia processes near amyloid plaques. Microglia from APP/PS1:Ms4a6d +/+ mice closely wrap around plaques (arrow head), whereas microglia from Ms4a6d deficiency mice show dysmorphic processes with looping structures (white arrows). Right panels show further zoomed images from the boxes on the left. e Quantification of the number of microglia near plaques, normalized by numbers in APP/PS1:Ms4a6d +/+ mice. f Representative confocal images and quantification of Aβ (immunostained with 4G8, green) engulfment within microglial (immunostained with Iba1, magenta) phagosomes (immunostained with CD68, blue). Right panels show further zoomed images from the boxes on the left. g Representative confocal images and quantification of CD68-positive vesicular structures in microglia around plaques. Right panels show separate fluorescence channel from the left image. In all panels, data are presented as mean ± S.E.M. Scale bars show 10 µm. N = 5 mice for APP/PS1:Ms4a6d +/+, n = 3 mice for APP/PS1:Ms4a6d +/−, n = 5 mice for APP/PS1:Ms4a6d -/-. One-way ANOVA tests with post hoc Tukey tests for panels b, c and e. Two-tail unpaired Student’s t-test for panels f and g. ns, not significant, **, P < 0.01, ***, P < 0.001, ****, P < 0.0001
Fig. 3
Fig. 3
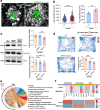
Ms4a6d-deficiency in APP/PS1 mice increases Aβ burden and markedly reduces plaque compaction. a Representative images of Thioflavin S staining of plaques in hippocampus area in APP/PS1 mice with different genotypes of Ms4a6d. Scale bar: 500 µm. b Quantification of percent area covered by Thioflavin S-positive amyloid plaques in several brain regions of APP/PS1 mice with different Ms4a6d genotypes. c Violin plots of the size distribution of all individual plaques in several brain regions from APP/PS1 mice with different Ms4a6d genotypes. d Quantification of amyloid plaques sizes in cortex. e Violin plots of individual plaques fluorescence intensity distribution in several brain regions of APP/PS1 mice with different Ms4a6d genotypes. f Representative heat-map images based on pixel intensity of Thioflavin S staining show distinct morphology of amyloid plaques in the presence or absence of Ms4a6d. Scale bar: 10 µm. g Example line graphs of the average Thioflavin S fluorescence intensity changes from plaque centers to the edges. Black lines indicate the linear regression lines for the declining segment from the curves. h Quantification of the fitted slopes of the declining segment of fluorescence from plaques of APP/PS1 mice with different Ms4a6d genotypes. In all panels, data are presented as mean ± S.E.M. N = 4 mice for each group. One-way ANOVA tests with post hoc Tukey tests for panels b, c, d, and e. Two-tail unpaired Student’s t-test for panel h. ns, not significant, *, P < 0.05, **, P < 0.01, ***, P < 0.001, ****, P < 0.0001. CTX, cortex; HC, hippocampus; DG, dentate gyrus; CA, cornu ammonis; BLA, basolateral amygdala; TH, thalamus; a.u., arbitrary unit
Fig. 4
Fig. 4
Ms4a6d deficiency dampens JAK2 signaling and promotes neuroinflammation. a Diagram of membrane Ms4a6d downstream signaling: Ms4a6d activates JAK2 phosphorylation, leading to the inhibition of p65 phosphorylation, production of NLRP3 and IL-1β. b-c Representative images and quantification of immunostaining of phosphorylated JAK2 (yellow) in microglia (magenta) around amyloid plaques (green). Prominent staining can be observed in microglia cell bodies (left) and processes (middle), which is absent in microglia lacking Ms4a6d (right). Lower panels show zoomed images from the boxes above. d-e Representative images and quantification of p65 phosphorylation (cyan) in processes adjacent to Aβ deposits (green) and somata of microglia (magenta) in the presence or absence of Ms4a6d. Right panels show zoomed images from the boxes. f-g Representative images and quantification of p65 phosphorylation accumulated in astrocytes (immunostained with GFAP, red) in the presence or absence of Ms4a6d. Right panels show zoomed images from the boxes. h-i Western blot images of NLRP3 in cortex and associated quantification. The experiments were replicated for three times. Uncropped gels or western blots can be found at Supplementary Fig. S7. j IL-1β levels in the cortex from wildtype, APP/PS1:Ms4a6d +/+ or APP/PS1:Ms4a6d -/- mice brains as measured by ELISA. In all panels, data are presented as mean ± S.E.M. Bars: 10 µm. For panels c, e and g, N = 5 mice for each group. N = 7 mice for each group in j. Two-tail unpaired Student’s t-test for panels c, e and g. One-way ANOVA tests with post hoc Tukey tests for panels i and j. *, P < 0.05, **, P < 0.01, ***, P < 0.001, ****, P < 0.0001
Fig. 5
Fig. 5
Ms4a6d deficiency exacerbates plaque-associated axonal spheroids, synapse loss and cognitive deficit. a Representative images of Lamp1-immunolabeled axonal spheroids (gray) around plaques (green). Scale bar: 10 µm. b Quantification of average spheroids size analyzed by individual plaques (left) or by mice (right). Each dot on the right indicates data from individual mouse. N = 6 mice for each group. c Western blot example images of pre-synaptic marker synaptophysin and post-synaptic marker PSD-95 in hippocampus and the associated quantification. Experiments were replicated for three times. Uncropped gels or western blots can be found at Supplementary Fig. S8. d Heatmap of the mice’s trajectories during in novel object recognition tests. The green and red boxes represent the boundaries of the familial and novel object, respectively. N = 10 mice for each group. e Left semicircular section: differentially expressed genes (DEGs) between MS4A6A over-expression and control groups. (red: log2FC > 0.5; purple: log2FC < −0.5). Right semicircular section: biological pathways with significant differential regulation. f Heatmaps of gene sets for inflammation, homeostasis, and disease-associated microglia functions. Color scale represents z-scores of expression levels. Lower panel shows averaged expression from the corresponding gene sets. N = 3 repeated experiments. In all panels, data are presented as mean ± S.E.M. Two-tail unpaired Student’s t-test for panel b. One-way ANOVA tests with post hoc Tukey tests for panels d and e. ns, not significant, *, P < 0.05, **, P < 0.01, ***, P < 0.001, ****, P < 0.0001. a.u., arbitrary unit

References

    1. van Dyck CH, Swanson CJ, Aisen P, Bateman RJ, Chen C, Gee M, et al. Lecanemab in early Alzheimer’s disease. N Engl J Med. 2023;388:9–21. - PubMed
    1. Sims JR, Zimmer JA, Evans CD, Lu M, Ardayfio P, Sparks J, et al. Donanemab in Early symptomatic alzheimer disease: the TRAILBLAZER-ALZ 2 randomized clinical trial. JAMA. 2023;330:512–27. - PMC - PubMed
    1. Sims R, Hill M, Williams J. The multiplex model of the genetics of Alzheimer’s disease. Nat Neurosci. 2020;23:311–22. - PubMed
    1. Migliore L, Coppedè F. Gene-environment interactions in Alzheimer disease: the emerging role of epigenetics. Nat Rev Neurol. 2022;18:643–60. - PubMed
    1. Jansen IE, Savage JE, Watanabe K, Bryois J, Williams DM, Steinberg S, et al. Genome-wide meta-analysis identifies new loci and functional pathways influencing Alzheimer’s disease risk. Nat Genet. 2019;51:404–13. - PMC - PubMed

LinkOut - more resources