. 2025 Aug 28;44(1):256.
doi: 10.1186/s13046-025-03522-4.

CDKN2A deletion is associated with immune desertification in diffuse pleural mesothelioma

Affiliations

CDKN2A deletion is associated with immune desertification in diffuse pleural mesothelioma

Federica Torricelli et al. J Exp Clin Cancer Res. .

Abstract

Introduction: Diffuse Pleural Mesothelioma (DPM) is a rare and incurable cancer. Immune checkpoint inhibitors (ICIs) marked some advances but only for a limited fraction of patients. Improving response prediction to ICIs is currently a clinical need in DPM. Deletion of CDKN2A gene, in chr9p21.3, is one of the most frequent alterations in DPM. As in other settings, deletion of CDKN2A locus has been associated with an immunosuppressive phenotype. Here we investigated the consequences of CDKN2A deletion (CDKN2Adel) on the tridimensional organization and function of immune infiltrate in DPM.

Methods: A retrospective cohort of 89 DPMs was analyzed and assessed for CDKN2Adel through digital droplet PCR. Immune-profiling was assessed by analyzing 770 immune-related genes by digital profiling. Finally, morphologically resolved, high-dimensional transcriptomic approach was used to reconstruct the spatial architecture of immune-tumor interaction in wild-type and deleted FFPE samples.

Results: CDKN2Adel was detected in 41.5% of DPMs and was associated with reduced survival (p = 0.04). Bulk gene expression identified 373 differentially expressed genes, of which 98.6% were downregulated in CDKN2Adel samples. These genes were enriched in several immune categories, suggesting significant immune deprivation in deleted tumors. Deconvolution analysis confirmed a major depletion of infiltrating immune cells including effector populations. Spatial transcriptomics revealed that this immunosuppressive phenotype was different according to histotype and prominent in the sarcomatoid lesions.

Conclusion: These data demonstrated that CDKN2Adel deeply affects the spatial organization of immune microenvironment by depleting immune-signaling and reducing or preventing immune infiltration, supporting the potential implementation of this alteration as ICIs predictive biomarker in DPM.

Keywords: CDKN2A; Diffuse pleural mesothelioma; Genetic alteration; Immunotherapy; Tumor immune microenvironment.


Conflict of interest statement

Declarations. Ethics approval and consent to participate: The study was approved by the AVEN ethical committee (131/2023/TESS/IRCCSRE – DIMPLE). Consent for publication: Not Applicable. Competing interests: The authors declare no competing interests.

Figures
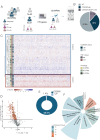
Fig. 1
Fig. 1
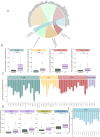
CDKN2adel associates with reduced survival probability A. Experimental study design. The status of CDKN2A deletion was investigated in 89 retrospective DPMs by ddPCR. 82 patients were successfully profiled. A panel of 770 immune related genes was analyzed by digital counts (nCcounter NanoString Technologies). B. Pie chart representing the percentage of WT, CDKN2A deleted and CDKN2Adel/IFN Idel patients in our cohort of 89 DPMs. C. Unsupervised clustering analysis based on gene expression on the entire cohort. Two clusters were identified. Color gradient expresses the z-score of each gene in each sample. Color tags indicate the genetic status (CDKN2A and IFN I) and histology. D. Volcano plot showing the expression and the Adjusted-Pvalue of DEGs in CDKN2Adel and WT DPMs. Orange dots represent significantly deregulated genes (Adjusted PValue < 0.05). E. Donut chart showing the percentage of up- regulated and downregulated DEGs obtained from CDKN2Adel and WT DPMs comparison. F. GO analysis of DEGs. Circular histograms illustrating the top scoring biological categories. For each biological category, colors gradient represents significance (Log10 adjusted PValue) while bars height represents the percentage of involved DEGs.
Fig. 2
Fig. 2
CDKN2Adel affects the immune transcriptional profile of DPM A. Chord plot representation of the convergence of DEGs on the indicated immune categories perturbed by CDKN2Adel. Arches are colored according to functional categories. B. Deconvolution analysis in CDKN2Adel versus WT DPMs. Boxplots represent the predicted scaled abundance of the indicated immune populations estimated on gene expression profiles. C. Bar plots report the differential expression of lineage specific markers for the indicated immune cell populations. For each gene the Y-axis represents the Log2Fold Change, in CDKN2Adel vs. WT DPMs. D. Deconvolution analysis in CDKN2Adel and WT DPMs. Boxplots represent the predicted scaled abundance of the indicated immune populations estimated based on gene expression profiles. E. Bar plots report the differential expression of MHC genes. For each gene the Y-axis represents the Log2Fold Change in CDKN2Adel vs. WT DPMs. PValue: *0.01–0.05, ** 0.001–0.01 *** <0.001
Fig. 3
Fig. 3
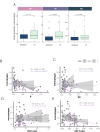
CDKN2Adel and macrophages in DPMs A. Deconvolution analysis in CDKN2Adel and WT DPMs of macrophage subpopulations. Boxplots represent the scaled abundance of the indicated macrophage subtypes estimated based on gene expression. B-E. Correlation plot of macrophages and B (B), NK (C), CD8 + T (D) and CD4 + T (E) cells predicted abundances in CDKN2Adel and WT DPMs. Spearman’s correlation was applied to calculate R coefficient and Pvalue.
Fig. 4
Fig. 4
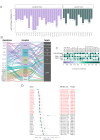
CDKN2Adel impairs chemotactic signals A. Bar plots report the differential expression of chemokines and related receptors significantly deregulated in gene expression analysis. For each gene the Y-axis represents the Log2Fold Change, in CDKN2Adel vs. WT DPMs. B. Alluvial plot showing the functional connection between deregulated cytokines, cytokine receptors and their target immune populations. Flows are colored according to cytokines. C. Correlation analysis between the expression of deregulated chemokines and the predicted abundance of the indicated immune populations. Asterisks indicate significant correlations (PValue < 0.05). Color intensity and square size are proportional to Spearman’s correlation coefficients. D. Forest plot illustrating the correlation between the expression of the indicated signaling genes and 2- years survival in our cohort. The cohort was dichotomized based on the median expression value of each gene. Green squares indicate hazard ratio value and horizontal lines represent 95% confidence
Fig. 5
Fig. 5
Differential effect of CDKN2Adel in epithelioid and sarcomatoid histotype A. Experimental design of the spatial transcriptomic analysis. Histological sections from 9 surgically resected DPMs were analyzed (N = 5 CDKN2adel, N = 4 WT). Epithelioid (E) and sarcomatoid (S) areas of illumination (AOIs) were selected based on cell morphology and expression of the Pan-CK marker. Collected AOIs were sequenced, and the expression of 1834 genes was analyzed. B. GeoMx DSP scan showing representative AOIs collected from a biph-DPM surgical biopsy. Insight displays the enlargement of representative transitional areas. Large circles identify selected biphasic areas. E-AOIs (red) and S-AOIs (blu) were selected based on morphology and Pan-CK signals. Small, light green circles indicate not segmented pure S-AOIs. C. Pie chart representing the percentage of DEGs (PValue < 0.05) in CDKN2Adel versus WT S-AOIs. D. Volcano plot showing expression and PValue of DEGs in the S-AOIs. Burgundy dots represent significantly deregulated genes (PValue < 0.05). E. Pie chart showing the distribution of downregulated and upregulated DEGs in S-AOIs. F. Pie chart representing the percentage of DEGs (PValue < 0.05) in CDKN2Adel versus WT E-AOIs. G. Volcano plot showing expression and PValue of DEGs in the E-AOIs. Violet dots represent significantly deregulated genes (Pvalue < 0.05). H. Pie chart shows the distribution of downregulated and upregulated DEGs in E-AOIs. I. GO analysis of downregulated genes in S-AOIs and E-AOIs. Circular histograms illustrate the top-scoring biological categories. Colors gradient represents significance (Log10 adjusted Pvalue) while bars height represents the percentage of involved DEGs for each category
Fig. 6
Fig. 6
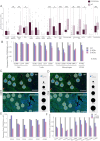
CDKN2Adel causes spatial tumor exclusion of immune cells in the S-AOIs A. Deconvolution analysis based on gene expression profile in S-AOIs. Bar plot shows the scaled abundance of each indicated population in CDKN2Adel and WT samples. B. Histograms showing the relative expression of lineage specific markers in CDKN2Adel as compared to WT DPMs (gray bars) in E-AOIs (purple bars) and S-AOIs (pink bars). C-D. Bubble plots showing expression of CD68 (C) and CD8 (D) in representative transitional areas, showing the difference between WT and CDKN2Adel S-AOIs. Large circles represent the selected AOIs. Blu dots inside the circle represent the level of expression of the indicated genes. Dots is proportional to the number of counts as reported in the figure. E-F. Histograms showing the relative expression of cytokines (E) and MHC genes (F) in E-AOIs (purple bars) and S-AOIs (pink bars) CDKN2Adel as compared to WT DPMs (grey bars). Pvalue: *0.01–0.05, ** 0.001–0.01 *** <0.001
Fig. 7
Fig. 7
(Graphical Abstract) Schematic representation of the proposed model. In DPM CDKN2Adel is associated with a decrease of the immune-activating signals, in particular of chemotactic cytokines, resulting in the exclusion of infiltrating immune cells in the tumor milieu. This effect is preferentially associated with the Sarcomatoid phenotypes and likely contributes to fostering aggressiveness of these lesions

References

    1. Janes SM, Alrifai D, Fennell DA. Perspectives on the treatment of malignant pleural mesothelioma. N Engl J Med. 2021;385:1207–18. - PubMed
    1. Robinson BM. Malignant pleural mesothelioma: an epidemiological perspective. Ann Cardiothorac Surg. 2012;1:491–6. - PMC - PubMed
    1. Giotti B, Dolasia K, Zhao W, Cai P, Sweeney R, Merritt E, Kiner E, Kim GS, Bhagwat A, Nguyen T, et al. Single-Cell view of tumor microenvironment gradients in pleural mesothelioma. Cancer Discov. 2024;14:2262–78. - PubMed
    1. Mangiante L, Alcala N, Sexton-Oates A, Di Genova A, Gonzalez-Perez A, Khandekar A, Bergstrom EN, Kim J, Liu X, Blazquez-Encinas R, et al. Multiomic analysis of malignant pleural mesothelioma identifies molecular axes and specialized tumor profiles driving intertumor heterogeneity. Nat Genet. 2023;55:607–18. - PMC - PubMed
    1. Galateau Salle F, Le Stang N, Tirode F, Courtiol P, Nicholson AG, Tsao MS, Tazelaar HD, Churg A, Dacic S, Roggli V, et al. Comprehensive molecular and pathologic evaluation of transitional mesothelioma assisted by deep learning approach: A Multi-Institutional study of the international mesothelioma panel from the MESOPATH reference center. J Thorac Oncol. 2020;15:1037–53. - PMC - PubMed

Substances