. 2025 Aug 28;13(1):39.
doi: 10.1186/s40170-025-00407-0.

Hyperlipidemia drives tumor growth in a mouse model of obesity-accelerated breast cancer growth

Affiliations

Hyperlipidemia drives tumor growth in a mouse model of obesity-accelerated breast cancer growth

Renan Fl Vieira et al. Cancer Metab. .

Abstract

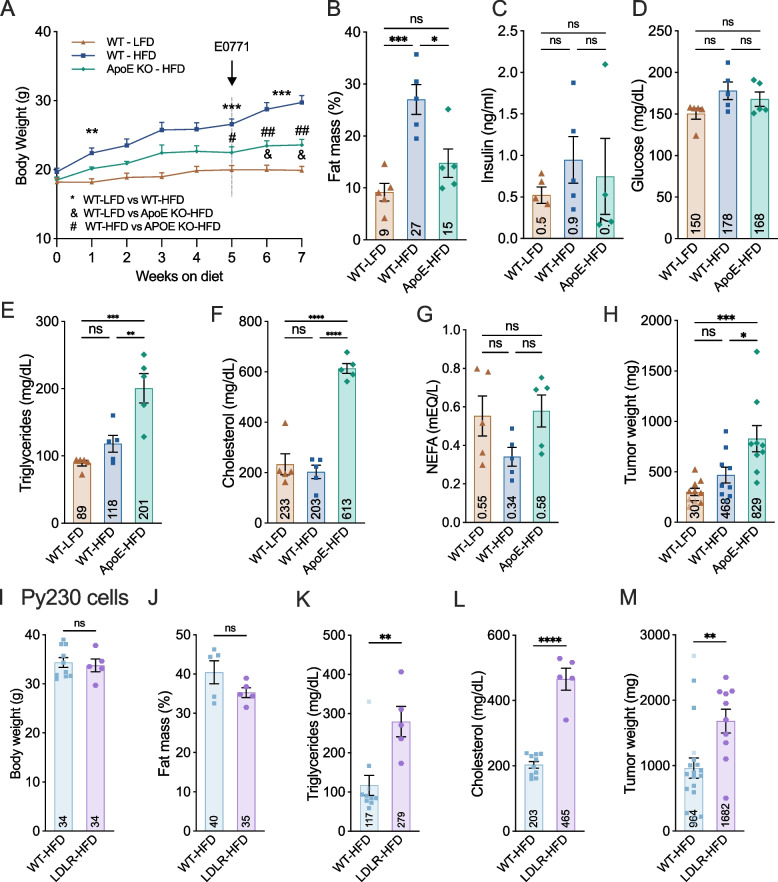
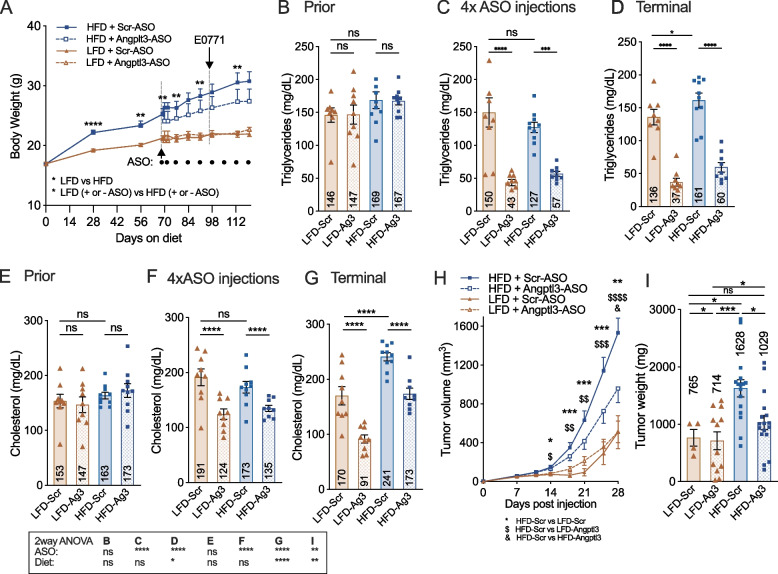
Obesity is an established risk factor for breast cancer (BC), yet the specific mechanisms driving this association remain unclear. Dysregulated lipid metabolism has emerged as a key factor in cancer cell biology, and, while obesity is often accompanied by hyperlipidemia, the isolated impact of elevated lipid levels on BC growth has not been experimentally tested. Using the E0771 and Py230 orthotopic models of obesity-accelerated BC growth in immune-competent mice, we investigated the role of systemic lipids on tumor growth. Combining dietary and genetic mouse models, we show that elevated circulating lipids are sufficient to accelerate BC tumor growth even in the absence of obesity or alterations in blood glucose and/or insulin levels. Pharmacological lowering of systemic lipid levels attenuates BC growth in obese mice, suggesting a direct role for lipids in fueling tumor expansion. Notably, we also show that weight loss alone, without a corresponding reduction in lipid levels such as that induced by a ketogenic diet, fails to protect against BC, highlighting the necessity of targeting lipid metabolism in obesity-associated BC. Our findings establish hyperlipidemia as a critical driver of BC progression and suggest that lipid-lowering interventions may be a promising strategy to mitigate BC risk in individuals with obesity.


Conflict of interest statement

Declarations. Competing interests: The authors declare no competing interests.

Figures

Fig. 1
Fig. 1
E0771 BC tumor growth is accelerated in female mice fed a 60% HFD. A Body weight over time in WT female C57BL/6 J mice (6–9 weeks old at start) fed a LFD (brown triangles, n = 20, pool of 2 independent cohorts, n = 10 mice in each) or HFD (blue squares, n = 17, pool of 2 independent cohorts, n = 10 and n = 7). E0771 are injected orthotopically in both the left and the right 4th mammary fat pad after 8–9 weeks on diets. LFD: low fat diet, 10% kcal from fat). HFD: high fat diet, 60% kcal from fat. B, C Total fat mass as (B) the percentage of total body weight during the first 4 weeks on diet and (C) average % fat mass of 3 independent cohorts after 7 to 8 weeks on diet prior to E0771 injections. D-H Blood glucose (D), plasma (E) insulin, (F) triglycerides, (G) cholesterol and (H) NEFA after 7–8 weeks on diet. I-M Fasting (I) blood glucose, plasma (J) insulin, (K) triglycerides, (L) cholesterol and (M) randomly-fed NEFA after 13 weeks on diet. N Glucose Tolerance Test (GTT) after 6 weeks on HFD. Mice were fasted overnight and glucose injected intraperitoneally at 1.5 mg/kg. O Insulin Tolerance Test (ITT) after 6 weeks on HFD. Mice were fasted 5 h during the light phase and insulin injected intraperitoneally at 0.75 UI/kg. Inset shows the drop in BG between the 15- and 5-min time points. P, Q E0771 Tumor volume over time (P) and weight at experimental endpoint (day 21) (Q). R, S WT 19 weeks old female C57BL/6 J mice fed a LFD (brown triangles, n = 10 mice, 17 tumors), or HFD (blue squares, n = 10, 12 tumors). Py230 cells were injected orthotopically in both the left and the right 4th mammary fat pad after 13 weeks on diets. Py230 Tumor volume over time (R), and tumor weight at experimental endpoint (day 48)(S). Statistics: A REML mixed-effects model with Sidak’s multiple comparisons post hoc test. Significance is shown as * for LFD vs HFD. B, N, P, R Two-way repeated measures ANOVA with Sidak’s multiple comparisons post hoc test. C-M, Q, S Unpaired t test. Individual data points are represented together with mean and sem. For all, * p < 0.05, ** p < 0.01, *** p < 0.001
Fig. 2
Fig. 2
E0771 tumor growth is accelerated in ApoE KO and LDLR KO mice fed a western diet. A Body weight of female WT C57BL/6 J mice fed a WD (blue squares, n = 5), ApoE KO on WD (green diamonds, n = 5), and LDLR KO on WD (purple circles, n = 4), and WT females fed a LFD (brown triangles, n = 5). 8-week-old mice were placed on diets for 4 weeks before E0771 cells injection and maintained on their diet during the 3 weeks of breast tumors growth. LFD: low fat diet, 10% kcal from fat. WD: western diet, 40% kcal from fat with 1.25% cholesterol. B Fat mass as the percentage of total body weight after 6 weeks on diets. C-G Plasma level of (C) insulin, (D) blood glucose measured with a glucometer, plasma (E) triglycerides, (F) cholesterol and (G) NEFA all in the randomly fed state 5 days before E0771 injections. H Tumor weights 3 weeks post injections. Data include the weights of all bilateral tumors that did not clear. (n = 6 for WT-LFD, n = 9 for WT-WD, n = 10 for ApoE-WD and n = 7 for LDLR-WD). Statistics: A Two-way Repeated measures ANOVA with Tukey’s multiple comparisons post hoc test. B-H One-way ANOVA with Tukey’s multiple comparisons post hoc test. Individual data points are represented together with mean and sem. For all, * p < 0.05, ** p < 0.01, *** p < 0.001
Fig. 3
Fig. 3
E0771 and Py230 growth in 60% HFD-fed WT, ApoE KO and LDLR KO mice. A Body weight of female WT C57BL/6 J mice on HFD (blue squares, n = 5), ApoE KO on HFD (green diamonds, n = 5) and WT on LFD (brown triangles, n = 5). 7-week-old mice were placed on diets for 5 weeks before E0771 cells injection and maintained on their diet during 3 weeks of tumor growth. LFD: low fat diet, 10% kcal from fat). HFD: high fat diet, 60% kcal from fat. B Fat mass as the percentage of total body weight after 4 weeks on diets. C Plasma fasting level of insulin prior to E0771 injections. D-G Blood glucose (D), plasma (E) triglycerides, (F) cholesterol and (G) NEFA in the randomly fed state prior to E0771 injections. H Tumor weights at endpoint 3 weeks post injections. Data include the weights of all bilateral tumors that did not clear. (n = 10 for WT-LFD, n = 9 for WT-HFD, n = 9 for ApoE-WD). I Body weight of female WT (blue squares, n = 10) and LDLR KO (purple hexagons, n = 5) after 6 weeks on HFD and a day prior to Py230 cells injection. HFD: high fat diet, 60% kcal from fat. J Fat mass as the percentage of total body weight after 6 weeks on diets. K,L Plasma fasting level of (K) triglycerides and (L) cholesterol upon euthanasia. M Tumor weights at endpoint 44 days post injections. Data include the weights of all bilateral tumors that did not clear (n = 19 for WT-HFD, n = 10 for LDLR-HFD). Statistics: A Two-way repeated measures ANOVA with Tukey’s multiple comparisons post hoc test. Significances are shown as * for WT-LFD vs WT-HFD, & for WT-LFD vs ApoE KO-HFD and # for WT-HFD vs APOE KO-HFD. B-H One-way ANOVA with Tukey’s multiple comparisons post hoc test. I-M Unpaired t test. Individual data points are represented together with mean and sem. For all, * p < 0.05, ** p < 0.01, *** p < 0.001
Fig. 4
Fig. 4
E0771 tumor growth can be accelerated by 90% fat ketogenic diet. A Body weight of female WT C57BL/6 J mice fed a 90% fat KD (pink circles, n = 20) or a LFD (brown triangles, n = 9). 8-week-old mice were placed on diets for 10 weeks before E0771 cell injection and maintained on their diet during the 3 weeks of tumor growth. LFD: low fat diet, 10% kcal from fat. KD: ketogenic diet, 90% kcal from fat. B Fat mass as the percentage of total body weight after 6 and 10 weeks on diets. C Plasma fasting level of insulin prior to E0771 injections. D-G Fasted and 4 h refed blood glucose measured with a glucometer (D) and plasma levels of (E) triglycerides, (F) cholesterol, and (G) NEFA. H, I Tumor weights at endpoint 3 weeks post injections (H) and average tumor volume over time (I). Data include the weights of all bilateral tumors that did not clear. (n = 9 for WT-LFD, n = 21 for WT-KD) Statistics: A REML mixed-effects model with Sidak’s multiple comparisons post hoc test. Significance is shown as * for LFD vs KD. B Two-way ANOVA with Tukey’s multiple comparisons post hoc test. C, H Unpaired t test. D-G REML mixed-effects model with Sidak’s multiple comparisons post hoc test. I Two-way repeated measures ANOVA with Sidak’s multiple comparisons post hoc test. Significance is shown as * for LFD vs KD. Individual data points are represented together with mean and sem. For all, * p < 0.05, ** p < 0.01, *** p < 0.001
Fig. 5
Fig. 5
Systemic lipid lowering attenuates obesity-accelerated E0771 tumor growth. A Body weight of female WT C57BL/6 J mice throughout the experiment. LFD: low fat diet, 10% kcal from fat. HFD: high fat diet, 60% kcal from fat. 7-week-old mice were placed on their respective diets for 10 weeks before ASOs injections. Half the mice on HFD received the Angptl3-ASO (blue dotted line, triangles, n = 10) and the other half the scramble-ASO (Scr-ASO, blue solid line, squares, n = 10). Half the mice on LFD received the Angptl3-ASO (brown dotted line, diamonds, n = 9) and the other half the scramble-ASO (brown solid line, triangles, n = 9). Mice were treated for 4 weeks (5 ASO injections) before E0771 injections. Weekly treatment and experimental diets were maintained for the 3 weeks of breast tumor growth. ASOs were injected subcutaneously on day 1 (experimental day 70), day 3 and day 7 of the first week and then weekly at 25 mg/kg. B-G Plasma levels of (B) triglycerides and (E) cholesterol prior to ASOs injections (experimental day 60), (C) triglycerides and (F) cholesterol after 4 ASOs injections (experimental day 85, random-fed), and (D) triglycerides and (G) cholesterol at euthanasia (experimental day 125, random-fed). H, I. Tumor volume over time (H) and (I) weight at experimental endpoint. Statistics: A REML mixed-effects model with Tukey’s multiple comparisons post hoc test. Significances are shown as * for LFD vs HFD prior to ASO injections, and as * for LFD (both with Scr-ASO and Angptl3-ASO) vs HFD (both with Scr-ASO and Angptl3-ASO) since no significant differences were detected between Angptl3-ASO and Scr-ASO treatments within each diet group. B-G, I Two-way ANOVA with Tukey’s multiple comparisons post hoc test. H. REML mixed-effects model with Sidak’s multiple comparisons post hoc test. Significances are shown as * for HFD-Scr vs LFD-Scr, $ for HFD-Scr vs LFD-Angptl3 and & for HFD-Scr vs HFD-Angptl3. Individual data points are represented together with mean and sem. For all, * p < 0.05, ** p < 0.01, *** p < 0.001
Fig. 6
Fig. 6
A Body weight of female WT C57BL/6 J mice throughout the experiment. 10-week-old females were placed on LFD or HFD for 11 weeks to induce weight gain prior to starting a weight loss (WL) intervention on KD. LFD: low fat diet, 10% kcal from fat. HFD: high fat diet, 60% kcal from fat. KD: ketogenic diet, 90% kcal from fat. Subsets of mice on HFD were either maintained on HFD (blue squares, n = 10), or switched to a KD (HFD- > KD, pink circles, n = 9) or to a LFD (HFD- > LFD, grey inverse triangles, n = 10). Mice on LFD stayed on LFD (brown triangles, n = 10). E0771 cells were injected 6.5 weeks after the start of the WL intervention and mice maintained on their dietary regimen during the 3.5 weeks of breast tumors growth. B Fat mass as the percentage of total body weight for a subset of mice at baseline (experimental day 0), after 11 weeks of weight gain before the start of the WL intervention, and before E0771 injections (experimental week 17.5). C Plasma fasting insulin 2 days prior to E0771 injections D-G Blood glucose (D), plasma (E) triglycerides, (F) cholesterol and (G) NEFA at terminal collection. H Tumor endpoint weights 24 days post injections. Data include the weights of all bilateral tumors that did not clear. (n = 17 for LFD, n = 15 for HFD, n = 18 for HFD- > LFD, n = 9 for HFD- > KD). I E0771 average tumor volume over time corresponding to Fig. 6H. Statistics: A REML mixed-effects model with Sidak’s multiple comparisons post hoc test. Significances are shown as * for LFD vs HFD, and as # for HFD vs HFD- > LFD. B-H One-way ANOVA with Tukey’s multiple comparisons post hoc test. Individual data points are represented together with mean and sem. For all, * p < 0.05, ** p < 0.01, *** p < 0.001. In I, significance is shown as * HFD vs LFD, # HFD vs HFD- > LFD, & HFD vs HFD- > KD, $ HFD- > LFD vs HFD- > KD

Similar articles

  • Hyperlipidemia drives tumor growth in a mouse model of obesity-accelerated breast cancer growth.
    Vieira RF, Sanchez SR, Arumugam M, Mower PD, Curtin MC, Gallop MR, Wright J, Bowles A, Ducker GS, Hilgendorf KI, Chaix A. Vieira RF, et al. bioRxiv [Preprint]. 2025 Feb 13:2025.02.10.637542. doi: 10.1101/2025.02.10.637542. bioRxiv. 2025. PMID: 39990404 Free PMC article. Preprint.
  • Prescription of Controlled Substances: Benefits and Risks.
    Preuss CV, Kalava A, King KC. Preuss CV, et al. 2025 Jul 6. In: StatPearls [Internet]. Treasure Island (FL): StatPearls Publishing; 2025 Jan–. 2025 Jul 6. In: StatPearls [Internet]. Treasure Island (FL): StatPearls Publishing; 2025 Jan–. PMID: 30726003 Free Books & Documents.
  • Systemic Inflammatory Response Syndrome.
    Baddam S, Burns B. Baddam S, et al. 2025 Jun 20. In: StatPearls [Internet]. Treasure Island (FL): StatPearls Publishing; 2025 Jan–. 2025 Jun 20. In: StatPearls [Internet]. Treasure Island (FL): StatPearls Publishing; 2025 Jan–. PMID: 31613449 Free Books & Documents.
  • Management of urinary stones by experts in stone disease (ESD 2025).
    Papatsoris A, Geavlete B, Radavoi GD, Alameedee M, Almusafer M, Ather MH, Budia A, Cumpanas AA, Kiremi MC, Dellis A, Elhowairis M, Galán-Llopis JA, Geavlete P, Guimerà Garcia J, Isern B, Jinga V, Lopez JM, Mainez JA, Mitsogiannis I, Mora Christian J, Moussa M, Multescu R, Oguz Acar Y, Petkova K, Piñero A, Popov E, Ramos Cebrian M, Rascu S, Siener R, Sountoulides P, Stamatelou K, Syed J, Trinchieri A. Papatsoris A, et al. Arch Ital Urol Androl. 2025 Jun 30;97(2):14085. doi: 10.4081/aiua.2025.14085. Epub 2025 Jun 30. Arch Ital Urol Androl. 2025. PMID: 40583613 Review.
  • Signs and symptoms to determine if a patient presenting in primary care or hospital outpatient settings has COVID-19.
    Struyf T, Deeks JJ, Dinnes J, Takwoingi Y, Davenport C, Leeflang MM, Spijker R, Hooft L, Emperador D, Domen J, Tans A, Janssens S, Wickramasinghe D, Lannoy V, Horn SRA, Van den Bruel A; Cochrane COVID-19 Diagnostic Test Accuracy Group. Struyf T, et al. Cochrane Database Syst Rev. 2022 May 20;5(5):CD013665. doi: 10.1002/14651858.CD013665.pub3. Cochrane Database Syst Rev. 2022. PMID: 35593186 Free PMC article.

References

    1. Bluher M. Obesity: global epidemiology and pathogenesis. Nat Rev Endocrinol. 2019;15(5):288–98. 10.1038/s41574-019-0176-8. Epub 2019/03/01 PubMed PMID: 30814686. - PubMed
    1. Lauby-Secretan B, Scoccianti C, Loomis D, Grosse Y, Bianchini F, Straif K. International Agency for Research on Cancer Handbook Working G Body Fatness and Cancer-Viewpoint of the IARC Working Group. N Engl J Med. 2016;375(8):794–8. 10.1056/NEJMsr1606602. PubMed PMID: 27557308; PMCID: PMC6754861 Epub 2016/08/25. - PMC - PubMed
    1. Heer E, Harper A, Escandor N, Sung H, McCormack V, Fidler-Benaoudia MM. Global burden and trends in premenopausal and postmenopausal breast cancer: a population-based study. Lancet Glob Health. 2020;8(8):e1027–37. 10.1016/S2214-109X(20)30215-1. PubMed PMID: 32710860 Epub 2020/07/28. - PubMed
    1. Munsell MF, Sprague BL, Berry DA, Chisholm G, Trentham-Dietz A. Body mass index and breast cancer risk according to postmenopausal estrogen-progestin use and hormone receptor status. Epidemiol Rev. 2014;36(1):114–36. 10.1093/epirev/mxt010. PubMed PMID: 24375928; PMCID: PMC3873844 Epub 2014/01/01. - PMC - PubMed
    1. Bluher M. An overview of obesity-related complications: The epidemiological evidence linking body weight and other markers of obesity to adverse health outcomes. Diabetes Obes Metab. 2025;27(Suppl 2):3–19. 10.1111/dom.16263. PubMed PMID: 40069923; PMCID: PMC12000860.Epub 2025/03/12. - PMC - PubMed

LinkOut - more resources