. 2025 Aug 28;23(1):969.
doi: 10.1186/s12967-025-07003-2.

Targeted soluble epoxide hydrolase inhibits M1 macrophage polarization to improve cartilage injury in temporomandibular joint osteoarthritis

Affiliations

Targeted soluble epoxide hydrolase inhibits M1 macrophage polarization to improve cartilage injury in temporomandibular joint osteoarthritis

Bing Yan et al. J Transl Med. .

Abstract

Background: Macrophage immunomodulation has emerged as a novel intervention and therapeutic strategy for temporomandibular joint osteoarthritis (TMJOA), potentially serving as a key approach for reducing synovial inflammation and promoting cartilage repair. The soluble epoxide hydrolase inhibitor (sEHi), TPPU, has shown potential therapeutic effects against inflammatory diseases and osteogenesis by elevating endogenous Epoxyeicosatrienoic acids (EETs). However, it remains largely unknown whether TPPU can reduce inflammation and cartilage degradation in the TMJOA.

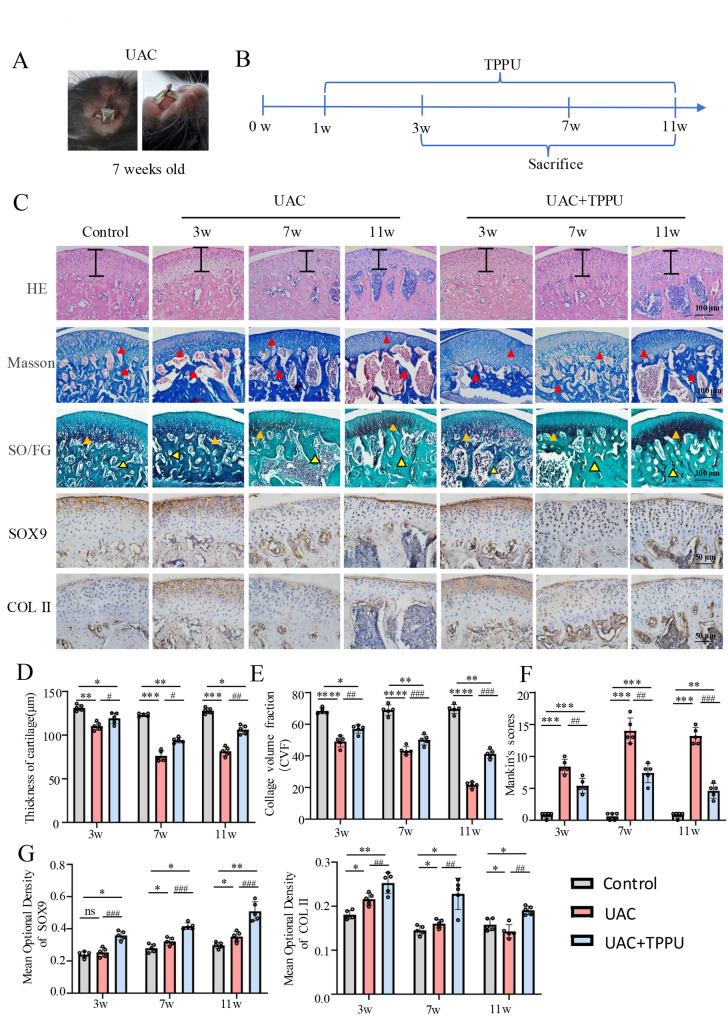
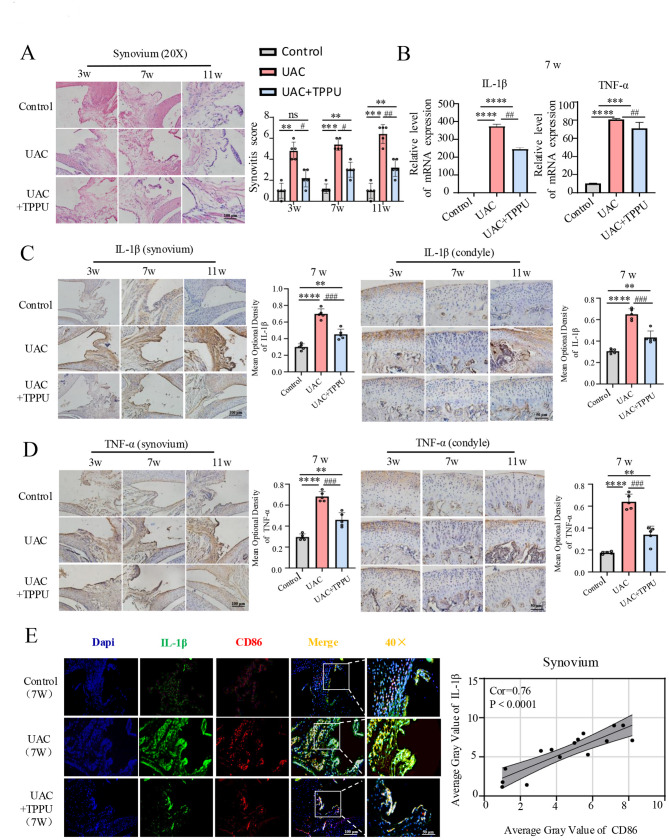
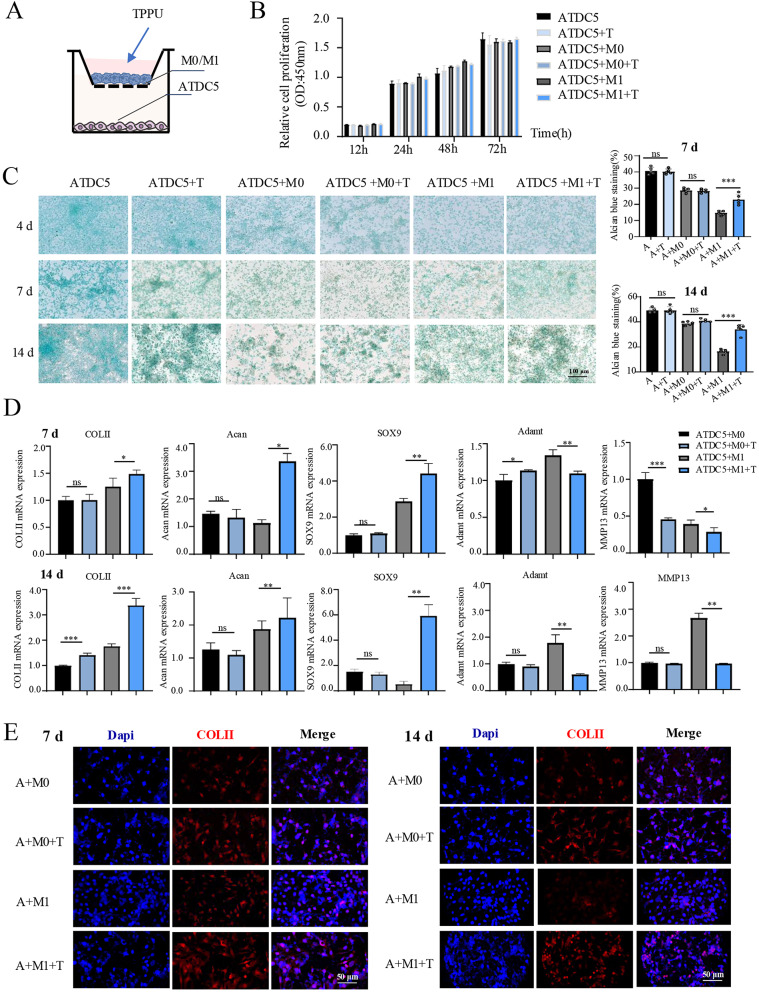
Methods: In vivo, the effects of TPPU on articular cartilage and synovial tissue pathology were assessed using H&E, Masson, Safranin-O/Fast Green staining and immunohistochemistry in a mouse model of TMJOA induced by unilateral anterior crossbite (UAC). RNA-seq and Western Blot was employed to investigate the key signal pathway of TPPU on M1 macrophage polarization. Subsequently, a co-culture system of macrophages and ATDC5 chondrocytes was established, and the influence of TPPU-treated macrophages on chondrogenesis was evaluated through Alcian Blue staining and RT-qPCR.

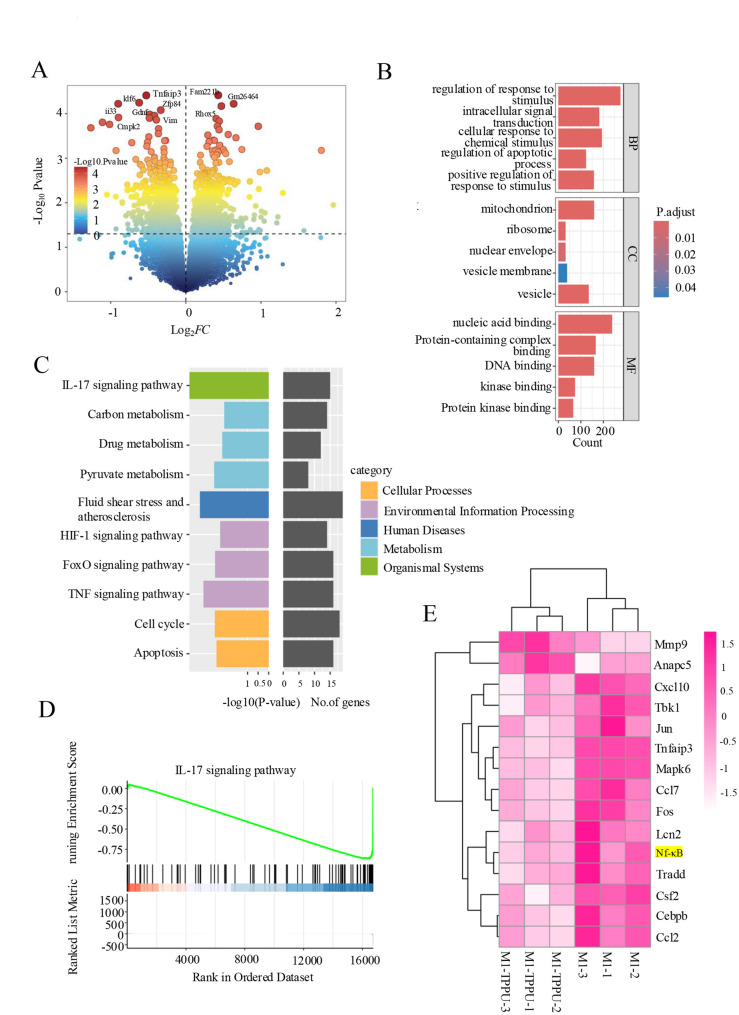
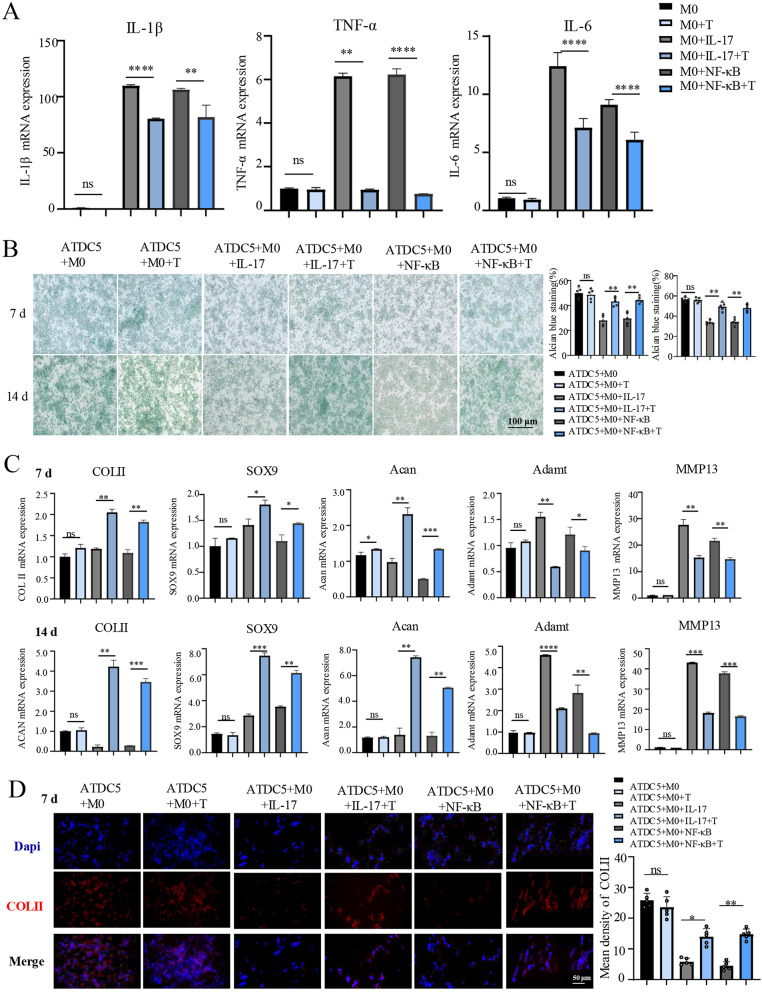
Results: In vivo, we observed that in UAC-induced TMJOA mice, TPPU significantly reduced the infiltration of inflammatory cells in the synovium and the positive expression of inflammatory factors TNF-α and IL-1β. It also mitigated the degradation of cartilage matrix and increased the positive expression of chondrogenic markers SOX9 and COL II. In vitro experiments revealed that TPPU inhibited the polarization of M1 macrophages, reduced inflammatory responses, and subsequently increased the expression of chondrogenic markers (SOX9 and COLII) in chondrocytes. RNA-seq data indicated that the NF-κB/IL-17 pathway as a putative target following TPPU treatment in macrophages. Further experiments confirmed that the addition of TPPU to macrophages inhibited the reduction in chondrogenesis induced by IL-17 and NF-κB agonists in the co-cultured cells.

Conclusions: Our study elucidates a novel role of TPPU in inhibiting M1 macrophage polarization and modulating inflammatory immune responses via the EETs/NF-κB/IL-17 axis, thereby inhibiting cartilage damage in TMJOA.

Keywords: EETs; IL-17; Macrophage; NF-κB; TMJOA; TPPU.


Conflict of interest statement

Declarations. Ethics approval and consent to participate: All procedures were conducted in accordance with the Declaration of Helsinki and approved by the Ethics Committee of Dalian Medical University (Approval No. 2023004). Written informed consent was obtained from all patients. All the animal experiments were approved by the Institutional Animal Care and Use Committee of Dalian Medical University (No. AEE22004). Consent for publication: Consent to publish has been obtained from all authors. Competing interests: The authors declare that they have no known competing financial interests or personal relationships that could have appeared to influence the work reported in this paper.

Figures

Fig. 1
Fig. 1
In vivo experiments demonstrate that TPPU reduces cartilage degeneration and bone destruction in TMJOA. (A) 7-week-old C57 mice were selected to establish a TMJOA model induced by UAC. (B) Schematic of the treatment protocol for TMJOA mice with TPPU. Mice were randomly assigned into three groups: Control, UAC, and UAC + TPPU. According to the timeline, the TPPU group was administered TPPU via gavage every other day (3 mg/kg) starting 1 week post-modeling, while the other two groups received an equivalent volume of normal saline. Subsequently, mice were euthanized at 3, 7, and 11 weeks post-modeling. (C) Representative images of H&E and Masson staining of TMJ tissue sections, as well as IHC staining for SOX9 and COL II. The black line segments represent the maximum thickness of cartilage. The red arrows indicate the collagen fibers of cartilage and subchondral bone. The orange arrows denote safranin staining of cartilage, and the yellow arrows indicate fast green staining of subchondral bone. (D) HE staining analysis of joint cartilage thickness changes and quantitative analysis (n = 5, one-way ANOVA followed by Tukey’s post-hoc test; * vs. Control, *p < 0.05, **P < 0.01, ***P < 0.001; # vs. UAC, # P < 0.05, ## P < 0.01). (E) Quantitative analysis of collagen volume fraction (CVF) in Masson staining (n = 5, one-way ANOVA followed by Tukey’s post-hoc test; * vs. Control, *p < 0.05, **P < 0.01, ****P < 0.0001; # vs. UAC, ## P < 0.01, ### P < 0.001). (F) Modified Mankin OA scoring to verify the inhibiting effect of TPPU treatment on condylar cartilage degeneration in TMJOA mice (n = 5, one-way ANOVA followed by Tukey’s post-hoc test; * vs. Control, **P < 0.01, ***P < 0.001; # vs. UAC, ## P < 0.01, ### P < 0.001). (G) Quantitative analysis of SOX9 and COL II expression by IHC (n = 5, one-way ANOVA followed by Tukey’s post-hoc test; * vs. Control, **P < 0.01; # vs. UAC, ## P < 0.01, ### P < 0.001; ns indicates no significant). Data are presented as mean ± SD
Fig. 2
Fig. 2
TPPU inhibits macrophage polarization towards the M1 phenotype. (A) The GSE205389 dataset displays a heatmap of the differential macrophage gene expression in the synovial tissue of TMJOA patients when compared to the normal (log10 of normalized counts). (B) Gene levels retrieved from the GEO database in normal and OA synovial tissue samples. (C) RT-qPCR detection of CD86 and INOS mRNA expression in M0 and M1 macrophages following TPPU treatment for 24 h (n = 3, unpaired two-tailed t-test; ***P < 0.001; ns indicates no significant). (D) Representative flow cytometry analysis images in M0 and M1 macrophages following TPPU treatment for 24 h. (E and F) Identification of M1 macrophages (CD68/INOS) in the synovial and subchondral bone using IF in 7 weeks TMJOA mice tissue section (n = 5, one-way ANOVA followed by Tukey’s multiple comparisons; * vs. Control, *p < 0.05, **P < 0.01, ****P < 0.0001; # vs. UAC, ### P < 0.001; ns indicates no significant). Data are presented as mean ± SD
Fig. 3
Fig. 3
TPPU reduces joint inflammation and exerts anti-inflammatory effects. (A) Representative images of the H&E staining of inflammatory synovial tissue from TMJOA mice induced by UAC at 3 weeks, 7 weeks, and 11 weeks, along with quantitative analysis of synovial inflammation scores (n = 5, one-way ANOVA followed by Tukey’s post-hoc test; * vs. Control, **P < 0.01, ***P < 0.001; # vs. UAC, # P < 0.05, ## P < 0.01; ns indicates no significant). (B) RT-qPCR detection of TNF-α and IL-1β mRNA expression in joint tissue of mice at the 7-week time point (n = 3, one-way ANOVA followed by Tukey’s post-hoc test; * vs. Control, ***P < 0.001, ****P < 0.0001; # vs. UAC, ## P < 0.01). (C and D) IHC and quantitative analysis of TNF-α and IL-1β in joint tissue sections (n = 5, one-way ANOVA followed by Tukey’s post-hoc test; * vs. Control, *p < 0.05, **P < 0.01, ***P < 0.001, ****P < 0.0001; # vs. UAC, ## P < 0.01, ### P < 0.001; ns indicates no significant). (E) IF staining and correlation analysis of CD86 and IL-1β in joint tissue sections (n = 15, two‑tailed Pearson’s correlation). Data are presented as mean ± SD
Fig. 4
Fig. 4
TPPU reduces chondrocyte degradation and exerts chondroprotective effects by targeting M1 macrophage polarization in vitro. (A) A co-culture system of Raw264.7 macrophages with ATDC5 cells was used to investigate the effect of TPPU on chondrogenesis. (B) The impact of M0/M1 macrophage-conditioned medium with or without TPPU treatment on the proliferation of ATDC5 cell proliferation was assessed using the CCK8 assay. (C) After inducing chondrocytes with M0/M1 macrophage-conditioned medium treated with or without TPPU for 7 and 14 days, Alcian Blue staining and quantitative analysis were utilized to assess the accumulation of proteoglycans in the cartilage formation matrix (n = 5, unpaired two-tailed t-test; **P < 0.01, ***P < 0.001; ns indicates no significant). (D) RT-qPCR was used to assess the expression of the anabolic markers (COLⅡ, Acan, SOX9) and catabolic markers (Adamts, MMP-13) in ATDC5 cells after 7 and 14 days of induction (n = 3, unpaired two-tailed t-test; *p < 0.05, **P < 0.01, ***P < 0.001; ns indicates no significant). (E) IF was employed to examine the effect of TPPU-treated macrophages on the expression of the anabolic COL II in chondrocytes. Data are presented as mean ± SD
Fig. 5
Fig. 5
The transcriptome reveals that TPPU inhibited the IL-17 signaling pathway in M1 phenotype macrophages. (A) Heatmap showing the top 10 differentially expressed genes. (B) Bubble chart displaying 5 GO enrichment terms for Biological Process (BP), Molecular Function (MF), and Cellular Component (CC). (C) A bar chart displaying 10 KEGG pathways obtained from pathway enrichment analysis. (D) The GSEA enrichment for IL-17 signaling pathway (NES = 1.708293, p value = 3.427046e−02). (E) The heatmap displays the genes that show changes in the IL-17 signaling pathway
Fig. 6
Fig. 6
TPPU inhibits macrophage polarization to the M1 phenotype through the lL-17 signaling pathway. (A) IHC detection of lL-17 expression among the three groups in TMJOA mice tissue sections (n = 5, one-way ANOVA followed by Tukey’s post-hoc test; * vs. Control, ***P < 0.001; # vs. UAC, ## P < 0.01, ### P < 0.001; ns indicates no significant). (B) ELISA for lL-17 expression in M0 and M1 macrophages with and without TPPU treatment (n = 3, unpaired two-tailed t-test; ***P < 0.001; ns indicates no significant). (C) RT-qPCR detection of mRNA expression of key factors of the lL-17 signaling pathway in M0 and M1 macrophages with and without TPPU treatment (lL-17 A, p-NF-κB, FOS, A20, Act1) (n = 3, unpaired two-tailed t-test; *p < 0.05, **P < 0.01; ns indicates no significant). (D) IF detection of the expression of the M1 macrophage marker CD86/INOS in M0 macrophages stimulated by lL-17 agonist (n = 5, unpaired two-tailed t-test; **P < 0.01; ns indicates no significant). (E) RT-qPCR detection of mRNA expression of the M1 macrophage marker CD86/INOS in M0 macrophages stimulated by lL-17 agonist (n = 3, unpaired two-tailed t-test; **P < 0.01, ***P < 0.001; ns indicates no significant). (F) Western blot detection of NF-κB pathway associated protein p-p65 expression and quantitative analysis (n = 3, unpaired two-tailed t-test; ***P < 0.001; ns indicates no significant). Data are expressed as mean ± SD
Fig. 7
Fig. 7
TPPU targets the NF-κB/IL-17 pathway in macrophages to promote chondrogenic differentiation and exert chondroprotective effects. (A) RT-qPCR for mRNA expression of inflammatory factors lL-1β, TNF-α, and lL-6 in macrophages treated with lL-17 agonists, NF-κB agonists, and TPPU (n = 3, unpaired two-tailed t-test; *p < 0.05, **P < 0.01, ***P < 0.001, ****P < 0.0001; ns indicates no significant). (B) Chondrocyte induction after 7 and 14 days of co-culture of M0 macrophages and ATDC5 cells treated with lL-17 agonists, NF-κB agonists, and TPPU, and observation of cartilage anabolism by Alcian blue staining and quantitative analysis (n = 5, unpaired two-tailed t-test; *p < 0.05, **P < 0.01; ns indicates no significant). (C) RT-qPCR detection for mRNA expression of anabolic markers (COLⅡ, Acan, SOX9) and catabolic markers (Adamts, MMP-13) in ATDC5 after 7 and 14 days of induction (n = 3, unpaired two-tailed t-test; *p < 0.05, **P < 0.01, ***P < 0.001; ns indicates no significant). (D) IF was used detected the expression of anabolic marker COLⅡ in ATDC5 after 7 days of induction (n = 5, unpaired two-tailed t-test; *p < 0.05, **P < 0.01; ns indicates no significant). Data are presented as mean ± SD
Fig. 8
Fig. 8
Graphic abstract. TPPU inhibiting M1 macrophage polarization and reducing cartilage degradation through the EETs/NF-KB/IL-17 signaling pathway

Similar articles

References

    1. Guo J, Su K, Wang L, Feng B, You X, Deng M, Toh WS, Wu J, Cheng B, Xia J. Poly(p-coumaric acid) nanoparticles alleviate temporomandibular joint osteoarthritis by inhibiting chondrocyte ferroptosis. Bioact Mater. 2024;40:212–26. - PMC - PubMed
    1. Manna CA, Costa M, Alves Filho CA, Beneti IM. Isolate or combined use of platelet-rich plasma in the treatment of temporomandibular joint osteoarthritis: a concise systematic review. MedNEXT Journal of Medical and Health Sciences. 2023. 10.54448/mdnt23S206.
    1. Pantoja LLQ, de Toledo IP, Pupo YM, Porporatti AL, De Luca Canto G, Zwir LF, Guerra ENS. Prevalence of degenerative joint disease of the temporomandibular joint: a systematic review. Clin Oral Investig. 2019;23:2475–88. - PubMed
    1. Liu X, Li H, Feng Y, Guo H, Li Y, Ke J, Long X. Resatorvid alleviates experimental inflammatory TMJOA by restraining chondrocyte pyroptosis and synovial inflammation. Arthritis Res Ther. 2023;25:230. - PMC - PubMed
    1. Li B, Jin Y, Zhang B, Lu T, Li J, Zhang J, Zhou Y, Wang Y, Zhang C, Zhao Y, Li H. Adipose tissue-derived extracellular vesicles aggravate temporomandibular joint osteoarthritis associated with obesity. Clin Transl Med. 2024;14: e70029. - PMC - PubMed

MeSH terms

Substances