. 2025 Oct;12(40):e17049.
doi: 10.1002/advs.202417049. Epub 2025 Aug 29.

Reprogramming of Fatty Acid Metabolism via PPARα-Orchestrated FADS2 in Keratinocytes Modulates Skin Inflammation in Psoriasis

Affiliations

Reprogramming of Fatty Acid Metabolism via PPARα-Orchestrated FADS2 in Keratinocytes Modulates Skin Inflammation in Psoriasis

Jiangluyi Cai et al. Adv Sci (Weinh). 2025 Oct.

Abstract

Psoriasis is a chronic inflammatory skin disorder characterized by keratinocyte hyper-proliferation and immune dysregulation. Recent evidence has implicated dysregulated polyunsaturated fatty acid (PUFA) metabolism in its pathogenesis. In this study, fatty acid desaturase 2 (FADS2), the rate-limiting Δ6-desaturase in PUFA biosynthesis, is identified as a central regulator of psoriatic inflammation. FADS2 expression is consistently reduced in keratinocytes from patients with psoriasis and in mouse models. Keratinocyte-intrinsic Fads2 knockdown exacerbates imiquimod-induced psoriasis-like dermatitis, which is marked by enhanced neutrophil recruitment and NF-κB activation, whereas Fads2 overexpression exerts protective effects and alleviates skin inflammation. In vitro, FADS2 knockdown in keratinocytes enhances M5-induced pro-inflammatory cytokine production, whereas FADS2 overexpression attenuates these effects. Lipidomic analysis reveals that impaired docosahexaenoic acid (DHA) biosynthesis is a key downstream consequence of FADS2 deficiency. Mechanistically, loss of FADS2 disrupts DHA biosynthesis, thus promoting an inflammatory response accompanied by increased NF-κB phosphorylation in keratinocytes to attract neutrophils. Furthermore, PPARα is identified as an upstream transcriptional activator of FADS2, and pharmacological activation of PPARα alleviates psoriatic inflammation in a FADS2-dependent manner. Together, these findings uncover a PPARα-FADS2-DHA-NF-κB axis that links lipid metabolism to immune regulation in psoriasis, highlighting a potential therapeutic strategy for restoring cutaneous immune homeostasis.

Keywords: FADS2; PPARα; fatty acid; inflammation; keratinocytes; psoriasis.


Conflict of interest statement

The authors declare no conflict of interest.

Figures

Figure 1
Figure 1
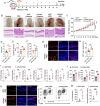
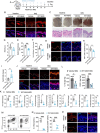
FADS2 is downregulated in keratinocytes of psoriatic lesions. A) Schematic illustration of the desaturation pathway of linoleic acid (omega‐6 [n‐6], red) and alpha‐linolenic acid (omega‐3 [n‐3], blue), catalyzed by key enzymes to generate long‐chain polyunsaturated fatty acids (LC‐PUFAs). B) Transcriptomic analysis of FADS2, FADS1, and ELOVL5 expression in lesional (PP) and non‐lesional (PN) skin of psoriasis patients (n = 58) and in normal skin from healthy controls (NN, n = 64) based on the GEO dataset GSE13355. C) Transcriptomic analysis of FADS2, FADS1, and ELOVL5 expression in baseline lesional (B‐LS) and non‐lesional (B‐NL) skin of psoriasis patients (n = 59), and in lesional skin after 12 weeks of guselkumab treatment (P‐LS), from GEO dataset GSE51440. D) RT‐qPCR validation of FADS2, FADS1, and ELOVL5 expression in normal skin from healthy controls (NN) (n = 4) and lesional skin tissue from psoriasis patients (PS) (n = 5). E–G) Representative immunofluorescence images of FADS2 (E), FADS1 (F), and ELOVL5 (G) staining, along with the keratinocyte marker K14, in normal skin from healthy controls and lesional skin tissue from psoriasis patients. Dashed line indicates the border between the epidermis and dermis. H) Representative immunofluorescence images of FADS2 and K14 co‐staining in lesional skin tissue from psoriasis patients at baseline and after 12 weeks guselkumab treatment. I) Representative immunofluorescence images of FADS2 and K14 co‐staining in healthy skin from control mice (Ctrl) and imiquimod (IMQ)‐induced psoriatic skin lesions. Scale bar, 50 µm. Data are presented as mean ± SD. Statistical significance was determined by one‐way ANOVA (B,C) or unpaired two‐tailed Student's t‐test (D). * P < 0.05, ** P < 0.01, *** P < 0.001, **** P < 0.0001; ns, not significant.
Figure 2
Figure 2
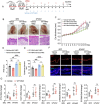
Silencing Fads2 aggravates IMQ‐induced psoriatic skin inflammation and enhances neutrophil infiltration. A) Schematic diagram of strategy for the application of Fads2 siRNA or control siRNA with IMQ or Vaseline treatment. B,C) Representative phenotypic images and hematoxylin‐eosin (H&E) staining image (B), and ear thickness of the indicated time points (C) following treatment with Fads2 siRNA or control siRNA after Vaseline (n = 5) or IMQ (n = 6) application, as well as Vaseline or IMQ treatment alone (n = 4) for 11 days. D–F) Quantification of psoriasis area and severity index (PASI) scores (D), epidermal thickness (E), and dermal immune cell infiltration (F) in mice after 11 consecutive days of IMQ treatment with Fads2 siRNA or control siRNA application (n = 6). G,H) Representative immunofluorescence images of Ki67 staining (G) and quantitation of Ki67+ epidermal cells (H) in IMQ‐induced skin lesions treated with Fads2 siRNA or control siRNA (n = 6). I) RT‐qPCR analysis of the indicated genes in the skin lesions after 11 days of IMQ treatment with Fads2 siRNA or control siRNA application (n = 6). J) ELISA quantification of IL‐17A, IL‐1β, and CXCL1 protein levels in the skin lesions following 11 days IMQ treatment with Fads2 siRNA or control siRNA application (n = 4). K) Representative immunofluorescence images of Ly6G (a neutrophil marker) staining in IMQ‐induced skin lesions treated with Fads2 siRNA or control siRNA. L,M) Representative flow cytometry plot (L) and quantification (M) of neutrophils in IMQ‐induced skin lesions treated with Fads2 siRNA or control siRNA (n = 4). Scale bar, 50 µm. Data are presented as mean ± SD. Statistical analysis was determined by two‐way ANOVA (C) or paired two‐tailed Student's t test (D‐F,H‐J,M). * P < 0.05, ** P < 0.01, *** P < 0.001, **** P < 0.0001.
Figure 3
Figure 3
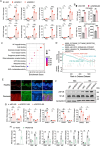
FADS2 modulates psoriatic inflammation in keratinocytes through NF‐κB activation. A) RT‐qPCR analysis of the indicated genes in HaCaT cells transfected with FADS2 siRNA (siFADS2) or control siRNA (siNC) for 24 h, followed by stimulation with PBS or a cytokine cocktail (M5) for 12 h (n = 3). B) ELISA quantification of CXCL1 and CXCL8 protein levels in both cell lysates and supernatants of HaCaT cells treated as (A) (n = 3). C) Top 10 enriched Gene Ontology (GO) molecular function terms from RNA‐sequencing (RNA‐seq) analysis of differential expression genes (DEGs) in FADS2‐silenced (siFADS2) versus control (siNC) HaCaT cells after M5 stimulation. DEGs were defined by |fold change| >1.5 & adjusted P<0.05. D) Gene set enrichment analysis (GSEA) of Kyoto Encyclopedia of Genes and Genomes (KEGG) pathway enrichment from RNA‐seq results in FADS2‐silenced (siFADS2) versus control (siNC) HaCaT cells after M5 stimulation. E) Representative immunofluorescence images of phosphorylated NF‐κB p65 (pNF‐κB) and K14 co‐staining in normal skin from healthy controls and lesional skin tissue from psoriasis patients. F) Immunoblotting of pNF‐κB and total‐NF‐κB p65 (NF‐κB) in HaCaT cells transfected with siFADS2 or siNC for 24 h and stimulated with PBS or M5 for 1 h. G) RT‐qPCR analysis of the indicated genes in HaCaT cells transfected with siFADS2 or siNC and stimulated with M5 after BAY 11–7082 or DMSO pretreatment (n = 3). H) RT‐qPCR analysis of FADS2 and the indicated genes in HaCaT cells transfected with FADS2 overexpression plasmids (FADS2 OE) or empty vector for 48 h followed by PBS or M5 treatment for 10 h (n = 3). Scale bar, 50 µm. Data are presented as mean ± SD. Statistical significance was determined by two‐way ANOVA (A,G,H) or unpaired two‐tailed Student's t‐test (B, H). * P < 0.05, ** P < 0.01, *** P < 0.001, **** P < 0.0001; ns, not significant.
Figure 4
Figure 4
Keratinocyte‐specific modulation of FADS2 expression by AAV9‐K14 delivery system alters IMQ‐induced skin inflammation. A‐I) BALB/c mice were subjected to IMQ‐induced psoriasis‐like dermatitis on the dorsal skin three weeks after intradermal injection of AAV9‐K14‐shFads2 or AAV9‐K14‐shNC. A) Representative phenotypic images and H&E staining images of IMQ‐induced skin lesions treated as (A‐I). B,C) Quantification of PASI scores (B) and epidermal thickness (C) of IMQ‐induced skin lesions treated as (A‐I) (n = 6). D,E) Representative immunofluorescence images of Ki67 staining (D) and quantitation of Ki67+ epidermal cells (E) in IMQ‐induced skin lesions treated as (A‐I) in the indicated locations (n = 4). F) RT‐qPCR analysis of the indicated genes in IMQ‐induced skin lesions treated as (A‐I) (n = 6). G,H) Representative flow cytometry plot (G) and quantification (H) of neutrophils in IMQ‐induced skin lesions treated as (A‐I) (n = 4). I) Representative immunofluorescence images of pNF‐κB and K14 co‐staining in IMQ‐induced skin lesions treated as (A‐I). J‐R) BALB/c mice were subjected to IMQ‐induced psoriasis‐like dermatitis on the dorsal skin three weeks after intradermal injection of AAV9‐K14‐flag‐Fads2 (AAV9‐K14‐Fads2) or AAV9‐K14‐NC (AAV9‐K14‐Ctrl). J) Representative phenotypic images and H&E staining images of IMQ‐induced skin lesions treated as (J–R). K,L) Quantification of PASI scores (K), epidermal thickness (L) in IMQ‐induced skin lesions treated as (J–R) (n = 6). M,N) Representative immunofluorescence images of Ki67 staining (M) and quantitation of Ki67+ epidermal cells (N) in IMQ‐induced skin lesions treated as (J‐R) (n = 4). O) RT‐qPCR analysis of the indicated genes in IMQ‐induced skin lesions treated as (J–R) (n = 6). P,Q) Representative flow cytometry plot (P) and quantification (Q) of neutrophils in IMQ‐induced skin lesions treated as (J–R) (n = 6). R) Representative immunofluorescence images of pNF‐κB and K14 co‐staining in IMQ‐induced skin lesions treated as (J–R). Scale bar, 50 µm. Data are presented as mean ± SD. Statistical significance was determined by unpaired two‐tailed Student's t‐test. * P < 0.05, ** P < 0.01, *** P < 0.001, **** P < 0.0001; ns, not significant.
Figure 5
Figure 5
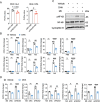
Decreased FADS2 disrupts PUFA metabolism that orchestrates psoriasiform inflammation in keratinocytes. A) PUFA ratios from LC‐MS/MS‐based lipidomic analysis showing desaturation indexes related to FADS2 in HaCaT cells transfected with FADS2 siRNA and control siRNA after M5 stimulation (n = 3). B) RT‐qPCR analysis of the indicated genes in HaCaT cells treated with DHA or vehicle for 24 h and stimulated with PBS or M5 for 12 h (n = 3). C) Immunoblotting of pNF‐κB and total‐NF‐κB in HaCaT cells treated with DHA or vehicle for 24 h and stimulated with M5 for 1 h. D) RT‐qPCR analysis of the indicated genes in HaCaT cells transfected with siFADS2 or siNC and stimulated with M5 after DHA or vehicle pretreatment (n = 3). Data are presented as mean ± SD. Statistical significance was determined by unpaired two‐tailed Student's t test (A) or two‐way ANOVA (B,D). * P < 0.05, ** P < 0.01, *** P < 0.001, **** P < 0.0001; ns, not significant.
Figure 6
Figure 6
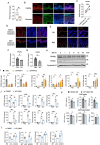
PPARα acts as an upstream positive regulator of FADS2 in psoriatic keratinocytes. A) RT‐qPCR analysis of PPARA expression in normal skin from healthy controls (NN, n = 4) and lesional skin tissue from psoriasis patients (PS, n = 5). B) Representative immunofluorescence images of PPARα and K14 co‐staining in normal skin from healthy controls and lesional skin tissue from psoriasis patients. C) RT‐qPCR analysis of PPARA in psoriatic lesional skin before and 10 weeks after infliximab treatment (n = 5). D) Representative images of PPARα immunofluorescence staining in lesional skin from psoriasis patients at baseline and week 10 following infliximab treatment. E) Representative immunofluorescence images of PPARα staining in healthy skin from control mice and skin lesions from IMQ‐induced psoriasis mouse model. F,G) RT‐qPCR analysis of PPARA (F) and FADS2 (G) expression in HaCaT cells stimulated with M5 for 12 h (n = 3). H) Immunoblotting of PPARα and FADS2 in HaCaT cells stimulated with M5 cytokines for the indicated time. I) RT‐qPCR analysis of PPARA, FADS2, and indicated genes in HaCaT cells transfected with PPARA siRNA (siPPARA) and control siRNA (siNC) for 24 h, followed by PBS or M5 stimulation for 12 h (n = 3). J) RT‐qPCR analysis of FADS2 and indicated genes in HaCaT cells pretreated with WY14643 or DMSO for 21 h, followed by PBS or M5 stimulation for 3 h (n = 3). K) ELISA quantification of CXCL1, CXCL8, and CSF3 protein levels in cell lysates and supernatants from HaCaT cells treated as in (J) (n = 3). L) RT‐qPCR analysis of the indicated genes in HaCaT cells transfected with siFADS2 and siNC for 24 h, followed by M5 stimulation for 3 h before WY14643 or DMSO pretreatment (n = 3). Scale bar, 50 µm. Data are presented as mean ± SD. Statistical significance was determined by unpaired two‐tailed Student's t test (A,F,G,K), paired two‐tailed Student's t test (C), or one‐way ANOVA (I,J,L). * P < 0.05, ** P < 0.01, *** P < 0.001, **** P < 0.0001; ns, not significant.
Figure 7
Figure 7
PPARα agonist WY14643 alleviates IMQ‐induced psoriasis‐like skin inflammation. A) Schematic diagram of experimental design involving topical application of WY14643 or vehicle in combination with IMQ or Vaseline treatment. B) Representative immunofluorescence images of PPARα staining in dorsal skin from mice treated with WY14643 or vehicle after IMQ or Vaseline treatment. C) Representative phenotypic images and H&E staining image of mouse dorsal skin treated with WY14643 or vehicle following IMQ or Vaseline treatment for 6 days. D–F) Quantification of PASI scores (D), epidermal thickness (E), and dermal cell infiltration (F) of mouse dorsal skin treated with WY14643 or vehicle after IMQ treatment for 6 days (n = 5). G,H) Representative immunofluorescence staining of Ki67 (G) and quantitation of Ki67+ epidermal cells (H) in IMQ‐induced skin lesions treated with WY14643 or vehicle in the indicated locations (n = 5). I) RT‐qPCR analysis of Fads2 in IMQ‐induced skin lesions treated with WY14643 or vehicle (n = 5). J) Representative immunofluorescence images of FADS2 staining in mouse dorsal skin treated with WY14643 or vehicle after IMQ or Vaseline treatment for 6 days. K) RT‐qPCR analysis of the indicated genes in IMQ‐induced skin lesions treated with WY14643 or vehicle (n = 5‐6). L) ELISA quantification of IL‐1β and CXCL1 protein levels in IMQ‐induced skin lesions treated with WY14643 or vehicle (n = 4). M,N) Representative flow cytometry plot (M) and quantification (N) of neutrophils in IMQ‐induced skin lesions treated with WY14643 or vehicle (n = 5). O) Representative immunofluorescence images of pNF‐κB staining in IMQ‐induced skin lesions treated with WY14643 or vehicle. Scale bar, 50 µm. Data are presented as mean ± SD. Statistical significance was determined by unpaired two‐tailed Student's t test. * P < 0.05, ** P < 0.01, *** P < 0.001, **** P < 0.0001; ns, not significant.
Figure 8
Figure 8
Fads2 knockdown abrogates the anti‐inflammatory effects of the PPARα agonist WY14643 in IMQ‐induced psoriasis‐like inflammation. A) Schematic diagram of experimental design involving topical administration of WY14643 or vehicle followed by IMQ treatment, prior to siFads2 or siNC application on mouse ear for 11 days. B,C) Representative phenotypic images and H&E staining images (B), ear thickness of the indicated time points (C) of ear skin lesion treated as (A). D,E) Quantification of PASI scores (D) (n = 5), epidermal thickness (E) (n = 6) of ear skin lesions treated as (A). F) Representative immunofluorescence images of Ki67 staining in IMQ‐induced skin lesion treated as (A). G) RT‐qPCR analysis of the indicated genes in IMQ‐induced skin lesion treated as (A) (n = 5). Scale bar, 50 µm. Data are presented as mean ± SD. Statistical significance was determined by two‐way ANOVA (C), one‐way ANOVA (D,E), or unpaired two‐tailed Student's t‐test (G). * P < 0.05, ** P < 0.01, *** P < 0.001, **** P < 0.0001; ns, not significant.
Figure 9
Figure 9
The PPARα‐FADS2‐PUFA axis regulates psoriasiform inflammation in keratinocytes. PPARα positively regulates FADS2 expression and thus promotes the desaturation of PUFAs. In psoriatic keratinocytes, reduced PPARα expression leads to downregulation of FADS2, resulting in decreased synthesis of DHA. This reduction enhances NF‐κB phosphorylation and subsequently upregulates psoriasis‐associated inflammatory cytokines and chemokines. These chemokines further promote neutrophil recruitment into skin lesions, aggravating psoriasis‐like inflammation. This figure was created with BioRender.com. Reproduced with permission. Copyright 2025, https://BioRender.com/rnyxsoi.

References

    1. Griffiths C. E. M., Armstrong A. W., Gudjonsson J. E., Barker J. N. W. N., Lancet 2021, 397, 1301. - PubMed
    1. Kim J., Krueger J. G., Annu. Rev. Med. 2017, 68, 255. - PubMed
    1. Wang X., Ma R., Shi R., Qin H., Chen W., Yu Z., Ding Y., Peng C., Shi Y., J. Transl. Med. 2023, 21, 834. - PMC - PubMed
    1. Myśliwiec H., Baran A., Harasim‐Symbor E., Myśliwiec P., Milewska A. J., Chabowski A., Flisiak I., Arch. Dermatol. Res. 2017, 309, 371. - PMC - PubMed
    1. Sarr O., Payne G. W., Hucik B., Abdelmagid S., Nakamura M. T., Ma D. W. L., Mutch D. M., J. Nutr. Biochem. 2019, 63, 140. - PubMed

LinkOut - more resources