. 2025 Oct;248(2):936-952.
doi: 10.1111/nph.70470. Epub 2025 Aug 29.

Pollen sterols are highly diverse but phylogenetically conserved

Affiliations

Pollen sterols are highly diverse but phylogenetically conserved

Ellen C Baker et al. New Phytol. 2025 Oct.

Abstract

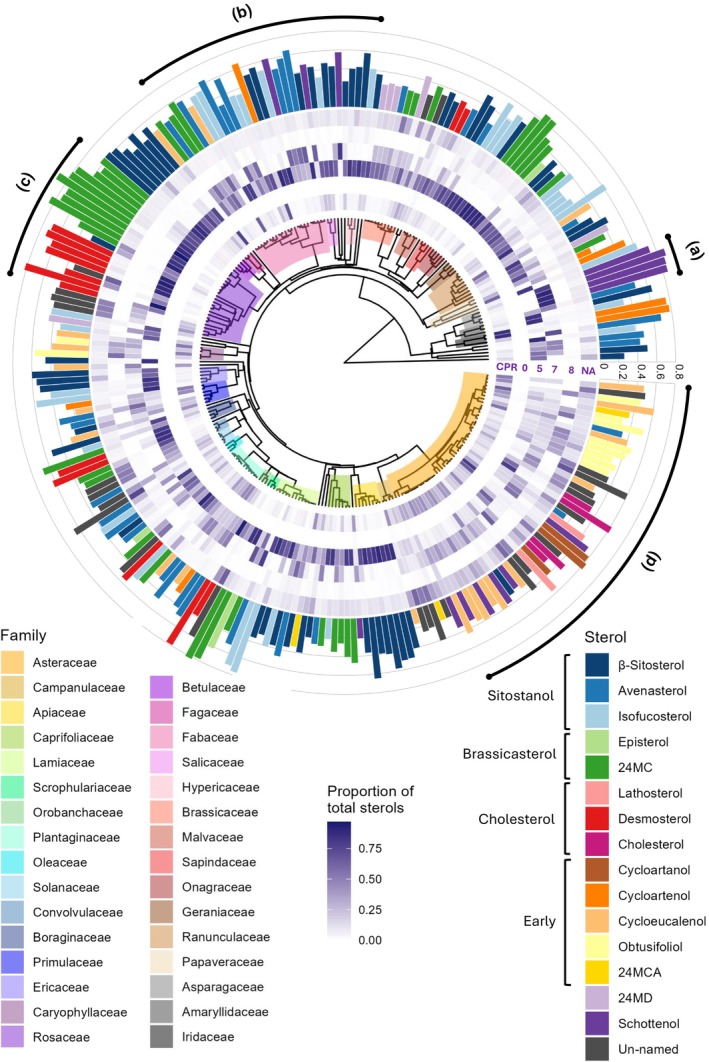
Phytosterols regulate cell membrane fluidity and are precursors for plant hormones and secondary metabolites in plants. Insects are auxotrophic for sterols; therefore, they have to consume phytosterols and dealkylate them to cholesterol. Some insects, including bees, which rely on dietary sources, primarily pollen, for sterols, cannot modify them; therefore, they have adapted to use them unmodified as they occur in pollen. Here, using high resolution chemical analysis, we describe the distribution of 78 different pollen sterols from 295 UK wildflower taxa and use this data to develop an evolutionary rationale for the diversity of sterols in pollen compared to vegetative tissues. The sterol occurrence in pollen was a function of plant lineage and conserved in groups as high as subfamily. Most pollen in the present study contained high proportions of Δ5 sterols including β-sitosterol, 24-methylenecholesterol and isofucosterol, which are important sterols for bees. The sterols recorded in honeybees occurred in the pollen of only 68% of plant taxa; however, none matched these proportions exactly, suggesting they must forage pollen from multiple plant taxa to satisfy their sterol requirements. We conclude that there is evidence for pollen sterol composition being the result of diverse driving forces including plant lineage and potentially pollinator nutritional requirements.

Keywords: phylogeny; phytosterol; plant lipids; pollen nutrients; pollinator guild.


Conflict of interest statement

None declared.

Figures

Fig. 1
Fig. 1
Many of the sterols abundant in pollen, such as 24‐methylenecholesterol, isofucosterol and β‐sitosterol, are not the end products of these synthesis pathways. Sterol synthesis pathway in plants collated from (Sucrow & Radüchel, ; Schaller, ; Morikawa et al., ; Desmond & Gribaldo, ; Villette et al., ; Sonawane et al., 2016). All sterols which could be named in this study using reference materials are shown, excluding ergosterol which is not synthesised by plants. Sterols which could only be identified to level two annotation (number of carbons and double bonds) are not shown. Sterols are coloured by section of the synthesis pathway to highlight structural similarities such as carbon count and emphasise branching points in the synthesis pathway.
Fig. 2
Fig. 2
Plant sterol profiles are diverse and variable, as revealed in a phylogenetic analysis illustrating the pollen sterol composition across 261 plant species. Phylogeny is adapted from (Zanne et al., 2014) showing all families with three or more species are highlighted (inner circle), proportion of total sterols (middle circle) and dominant sterols (outer circle). Families can be read from the right of the phylogeny in a clockwise direction, following the legend top left to bottom right. The inner rings show a heatmap of sterol proportions grouped according to B‐ring saturation (cyclopropane ring (CPR), Δ0, Δ5, Δ7, Δ8 and NA). All sterols which could not be assigned a name using reference materials were categorised as NA for B‐ring saturation. In addition, ergosterol which is both Δ5 and Δ7 was classed as NA. This heatmap shows a dominance of Δ5 sterols across the dataset and very low proportions of Δ0 sterols (stanols). Outer bars show the proportion and identity of the most dominant sterol in each species, showcasing the diversity of sterol production of pollen. All named sterols are grouped according to their position in the sterol synthesis pathway. (a) Despite the diversity of the sterolome in many pollens, some species are strongly dominated by a single sterol. This can be seen in these Asparagaceae pollens, which mostly contain schottenol. (b) In some areas of the tree, sterols close together in the synthesis pathway are produced in high proportions by related species. In this case, β‐sitosterol, avenasterol and isofucosterol are the dominant sterols in a range of Fabaceae, Salicaceae and Hypericaceae species. (c) There are clear switches in the dominant sterol between some taxa; within the two Rosaceae subfamilies plotted, Amygdaloideae is dominated by 24‐methylenecholesterol, whilst Rosoideae is dominated by desmosterol. (d) Asteraceae represented our most sampled family and showed an interesting sterol profile compared to other families. Species contained higher proportions of sterols with a cyclopropane ring or where B‐ring saturation could not be determined (NA) than other families.
Fig. 3
Fig. 3
Several sterols found in the Asteraceae are uncommon and unique to this plant family. (a) NMDS biplot showing differences in sterol profile between Asteraceae subfamilies Asteroideae, Carduoideae and Cichorioideae. All pairwise differences between groups were significant (PERMANOVA, P < 0.005) and each subfamily was associated with at least six level two annotated sterols which distinguished them from other Asteraceae species (ISA, Supporting Information Table S10). Plot stress value was 0.166 and groups showed significantly different variances with Carduoideae species showing the smallest variation in sterolome. Asteroideae and Carduoideae species also showed the greatest overlap in sterolome. (b) Comparison of sterol composition between Asteraceae subfamilies (Asteroideae (21 spp.), Carduoideae (14 spp.) and Cichorioideae (17 spp.)) and all other species (226 spp.) when sterols are grouped by B‐ring saturation (left to right:Δ0, Δ5, Δ7, Δ8, cyclopropane ring (CPR), NA, example structures shown in Fig. 1). On average, non‐Asteraceae species were dominated by Δ5 sterols. By contrast, Asteraceae flowers had higher levels of CPR, Δ7 and Δ8 sterols. Within Asteraceae, Carduoideae had a dominance of Δ7 sterols and Asteroideae showed a higher proportion of Δ8 sterols. The plot shows the first and third quartile, median and 1.5× interquartile range.
Fig. 4
Fig. 4
Sterol profiles are phylogenetically conserved in several plant genera. (a) Sterol composition of species belonging to repeatedly sampled genera in the most sampled families; Asteraceae, Fabaceae and Rosaceae. The magnitude of intergenus differences varied widely; some confamilial genera share similar sterolomes (Vicia and Ulex, Centaurea and Cirsium) whilst others are dominated by different sterols (Rubus and Prunus, Crepis and Cirsium). Within genera, sterolomes appeared largely consistent between species. All non‐major sterols have been collapsed into ‘All other sterols’ and all sterols annotated to level two (carbon count and double bond saturation) are included as ‘Un‐named’. Sterols are coloured left‐to‐right following figure legend bottom‐to‐top. (b) Sterol composition of species collected from at least four counties and with at least five samples total. Tripolium pannonicum shows the highest proportion of sterols which could only be annotated to level two (carbon count and double bond saturation) suggesting there is still much we do not know about sterol production in this species. Species generally show a strong consistency in sterolome, this is reflected in tight group distributions when plotted by NMDS (c). All non‐major sterols have been collapsed into ‘All other sterols’ and all sterols annotated to level two are included as ‘Un‐named’. Sterols are coloured left‐to‐right following figure legend bottom‐to‐top. (c) NMDS plot of proportion data from samples shown in (b) arcsine square root transformed. Difference among species groups were significant (P = 0.001) and variance was not significantly different (P = 0.729). This suggests there is consistency in sterol profile between variable abiotic conditions which aligns with a strong genetic control of sterol production, as indicated by the phylogenetic signal across the data. Lines show associations with different sterols, only sterols with significant (P < 0.0100 and strong > 0.7) associations were used. Stress value of NMDS was 0.096.
Fig. 5
Fig. 5
Sterol profiles of bee pollinators are unlikely to match the sterol profiles found in pollen. (a) Subsection of an NMDS comparing 18 honeybee prepupae sterol samples from Svoboda et al. (1980) with all hand collected pollen units reported in this paper (278). Bees and pollen showed significantly different sterol profiles and the stress value of the 3D NMDS was 0.101. Only those pollens closest to the bees in NMDS space are plotted here in 2D for clarity. Many species that are popular with honeybees, for instance Rubus fruticosus, did not cluster closely with honeybees suggesting that similarity in sterol profile alone does not motivate foraging by honeybees. Pollens showed a much wider variation in sterolome than the bees though this is to be expected as they cover a much wider ecological and taxonomic range. Pollen also contains a much wider array of sterols compared to honeybees and so no pollen is likely to directly resemble honeybee tissues. (b) Proportions of honeybee‐relevant sterols for all plant species shown in (a) plus a mean of the 18 honeybee prepupae sterol samples from (Svoboda et al., 1980). All pollens contained high proportions of 24‐methylenecholesterol, β‐sitosterol and isofucosterol. However, many pollens contained more isofucosterol and less 24‐methylenecholesterol and β‐sitosterol than bees. In addition, honeybee prepupae contained higher proportions of cholesterol than any of the similar pollen. It is again clear that no individual pollen will provide all the sterols required by honeybees in their requisite proportions. Sterols in this figure are coloured left‐to‐right following the figure legend bottom‐to‐top.
Fig. 6
Fig. 6
Most plant sterol profiles do not supply all of the sterols required by honeybees. (a) Summary of how many pollen species met the sterol requirements identified from analysis of prepupal honeybee tissues (24‐methylenecholesterol > 30%, β‐sitosterol > 19%, isofucosterol > 10%, campesterol > 5%, cholesterol > 0.5%, desmosterol > 0.5% – Svoboda et al. (1980)). Out of 278 species, 88 met none of these requirements, only 32 contained three or more at the required levels. A single species, Ballota nigra, fulfilled four of the six required (β‐sitosterol, isofucosterol, campesterol and cholesterol). (b) The 10 highest producing species for the six sterols detected in honeybee tissues (Svoboda et al., 1980). Campesterol and cholesterol are only ever present in lower proportions and are never dominant in pollen, unlike 24‐methylenecholesterol, desmosterol and isofucosterol, which are over 75% of total sterols in the highest producing species. Similarities in sterol production between related species mean many of the top species for a sterol belong to a single family. Dominant families are highlighted by species names in black. 24‐Methylenecholesterol: Rosaceae, Campesterol: Apiaceae, Cholesterol: Asteraceae, Desmosterol: Rosaceae. Sterols are coloured according to their positioning in the plant sterol synthesis pathway in Fig. 1.

References

    1. Bakker JD. 2024. Applied multivariate statistics in R . University of Washington. [WWW document] URL https://uw.pressbooks.pub/appliedmultivariatestatistics/ [accessed 11 August 2025].
    1. Baude M, Kunin WE, Boatman ND, Conyers S, Davies N, Gillespie MAK, Morton RD, Smart SM, Memmott J. 2016. Historical nectar assessment reveals the fall and rise of floral resources in Britain. Nature 530: 85–88. - PMC - PubMed
    1. Behmer ST. 2017. Overturning dogma: tolerance of insects to mixed‐sterol diets is not universal. Current Opinion in Insect Science 23: 89–95. - PubMed
    1. Behmer ST, Elias DO. 2000. Sterol metabolic constraints as a factor controbuting to the maintenance of diet mixing in grasshoppers (Orthoptera: Acrididae). Physiological and Biochemical Zoology 73: 219–230. - PubMed
    1. Behmer ST, Nes WD. 2003. Insect sterol nutrition and physiology: a global overview. In: Simpson S, ed. Advances in insect physiology, vol. 31. London, UK: Academic Press, 1–72.

LinkOut - more resources