. 2025 Sep 2;14(17):eJAHA2025041738T.
doi: 10.1161/JAHA.125.041738. Epub 2025 Aug 29.

Characterizing Stroke Clots Using Single-Cell Sequencing

Affiliations

Characterizing Stroke Clots Using Single-Cell Sequencing

Daniela Renedo et al. J Am Heart Assoc. .

Abstract

Background: Ischemic stroke results in significant morbidity and mortality. By examining gene expression of cells comprising stroke clots, we aim to gain valuable insights into the underlying mechanisms of this disease and identify potential biomarkers of stroke cause.

Methods: We employed single-cell RNA sequencing to analyze 10 clot samples from patients diagnosed with large vessel occlusion stroke. We aimed to identify and compare the immune cell compositions and gene expression profiles between stroke clots (atrial fibrillation vs carotid atherosclerosis). We also used Multi-marker Analysis of Genomic Annotation and genome-wide association studies summary statistics from the GIGASTROKE consortium to assess associations between genetic variants and cell type-specific gene expression within the stroke subtypes.

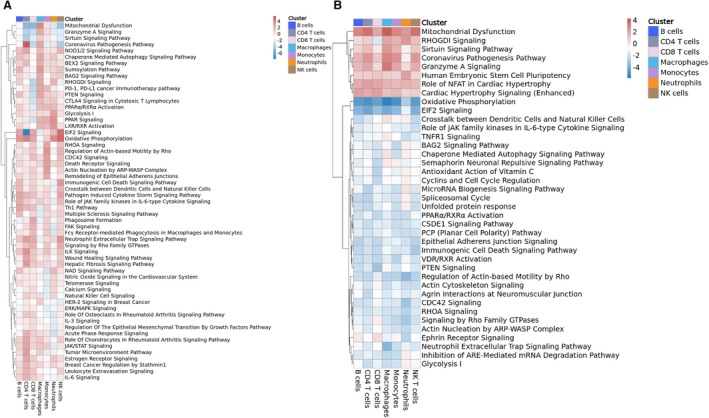
Results: Our analysis revealed distinct immune cell populations, including monocytes, macrophages, dendritic cells, neutrophils, and T cells in both clot types. Notably, we observed significant differences in gene expression within the mononuclear phagocytic system cells between clots from patients with atrial fibrillation and carotid atherosclerosis. We identified specific genes associated with atherosclerosis and stroke-related processes, such as CD74, HLA-DRB1*01, HTRA1, C1Q, CD81, and CR1 from patients with carotid atherosclerosis. In atrial fibrillation clots, CD8 T cells and natural killer cells show upregulated expression of genes such as GZMH, GZMB, S100A4, FCGBP2, HLA-A, TIMP1, CLIC1, and IFITM2, indicating their involvement in cytotoxic activities and potential tissue damage. The Multi-marker Analysis of Genomic Annotation approach highlighted significant genetic associations within leukocytes underscoring the potential roles of B cells, T cells, and macrophages in clot pathogenesis.

Conclusions: This study illuminates the immune and transcriptomic landscape within clots, offering potential biomarkers and lays the foundation for future research.

Keywords: immune cell profiling; single‐cell RNA sequencing; stroke cause.


Conflict of interest statement

Dr Matouk is a consultant for Penumbra, Terumo Neurovascular, and Boston Scientific.

Figures

Figure 1
Figure 1. Study overview and immune cell type identification in stroke clots.
A, Schematic overview of the study, illustrating the workflow and key objectives. Figure created with BioRender.com. B, Uniform Manifold Approximation and Projection plot displaying the identified immune cell types within clots. DC indicates dendritic cells; NK, natural killer; and TEM, effector memory T cells.
Figure 2
Figure 2. Volcano plots.
A, Macrophages DEG between atrial fibrillation clots and carotid atherosclerosis clots. B, Monocytes DEG between atrial fibrillation clots and carotid atherosclerosis clots. C, CD8 T cells DEG between atrial fibrillation clots and carotid atherosclerosis clots. D, Macrophages DEG between venous and arterial clots. E, Monocytes DEG between venous and arterial clots. F, CD8 T cells DEG between venous and arterial clots. DEG indicates differential gene expression.
Figure 3
Figure 3. Ingenuity pathway analysis of differential gene expression results.
A, Heatmap with IPA of DEG between carotid atherosclerosis clots and atrial fibrillation clots for all clusters (cell types). Red upregulated in AF stroke clots. B, Heatmap with IPA of DEG between venous and arterial clots. Red upregulated in venous clots. AF indicates atrial fibrillation; DEG, differential gene expression; IPA, Ingenuity Pathway Analysis; and NK, natural killer.
Figure 4
Figure 4. Interactions among immune cell types in atrial fibrillation and carotid atherosclerosis clots.
A, Heatmaps displaying the number of significant interactions among cell types in AF clots. B, Heatmaps displaying the number of significant interactions among cell types in carotid atherosclerosis clots. C, Heatmaps displaying the number of significant interactions among cell types in venous clots. D, Circos plot illustrating significant interactions between DC within AF clots and Venn diagram showing the number of significant interactions shared and the number of unique interactions between causes in DC cells. E, Circos plot illustrating significant interactions between NK cells within AF clots and Venn diagram showing the number of significant interactions shared and the number of unique interactions between causes in NK cells. *The legend accompanying the Venn diagrams provides the names of specific unique interactions. AF indicates atrial fibrillation; DC, dendritic cell; NK, natural killer; and VTE, venous thromboembolism.
Figure 5
Figure 5. MAGMA workflow and cell‐type analysis in human stroke clots.
A, Schematic representation of the MAGMA workflow using the GIGASTROKE, GERD and height GWAS. B, Bar plots depict the relationship between various cell types in atrial fibrillation. Clots and P values obtained from the MAGMA gene analysis for each different GWAS. The red lines represent the P value threshold of <0.05, indicating statistically significant associations. C), Bar plots depict the relationship between various cell types in carotid atherosclerosis clots and the P values obtained from the MAGMA gene analysis for each different GWAS. The red lines represent the P value threshold of <0.05, indicating statistically significant associations. GERD indicates gastroesophageal reflux disease; GWAS, genome‐wide association studies; and MAGMA, Multimarker Analysis of Genomic Annotation.

References

    1. Tsao CW, Aday AW, Almarzooq ZI, Anderson CAM, Arora P, Avery CL, Baker‐Smith CM, Beaton AZ, Boehme AK, Buxton AE, et al. Heart disease and stroke statistics—2023 update: a report from the American Heart Association. Circulation. 2023;147:e93–e621. doi: 10.1161/CIR.0000000000001123 - DOI - PMC - PubMed
    1. Renedo D, Acosta JN, Leasure AC, Sharma R, Krumholz HM, De Havenon A, Alahdab F, Aravkin AY, Aryan Z, Bärnighausen TW, et al. Burden of ischemic and hemorrhagic stroke across the US from 1990 to 2019. JAMA Neurol. 2024;81:394–404. doi: 10.1001/jamaneurol.2024.0190 - DOI - PMC - PubMed
    1. Sporns PB, Jeibmann A, Minnerup J, Broocks G, Nawabi J, Schön G, Fiehler J, Wildgruber M, Heindel W, Kemmling A, et al. Histological clot composition is associated with Preinterventional clot migration in acute stroke patients. Stroke. 2019;50:2065–2071. doi: 10.1161/STROKEAHA.118.023314 - DOI - PubMed
    1. Fitzgerald S, Mereuta OM, Doyle KM, Dai D, Kadirvel R, Kallmes DF, Brinjikji W. Correlation of imaging and histopathology of thrombi in acute ischemic stroke with etiology and outcome. J Neurosurg Sci. 2019;63:292–300. doi: 10.23736/S0390-5616.18.04629-5 - DOI - PMC - PubMed
    1. Kim SK, Yoon W, Kim TS, Kim HS, Heo TW, Park MS. Histologic analysis of retrieved clots in acute ischemic stroke: correlation with stroke etiology and gradient‐Echo MRI. Am J Neuroradiol. 2015;36:1756–1762. doi: 10.3174/ajnr.A4402 - DOI - PMC - PubMed