. 2025 Aug 29;9(9):e0768.
doi: 10.1097/HC9.0000000000000768. eCollection 2025 Sep 1.

Evidence that extracellular HSPB1 contributes to inflammation in alcohol-associated hepatitis

Affiliations

Evidence that extracellular HSPB1 contributes to inflammation in alcohol-associated hepatitis

Anne-Marie C Overstreet et al. Hepatol Commun. .

Abstract

Background: Alcohol-associated hepatitis (AH) is the most life-threatening form of alcohol-associated liver disease (ALD). AH is characterized by severe inflammation attributed to increased levels of ethanol, microbes or microbial components, and damage-associated molecular pattern (DAMP) molecules in the liver. HSPB1 [Heat Shock Protein Family B (Small) Member 1; also known as Hsp25/27] is a DAMP released from stressed cells, including hepatocytes. The goal of this study was to define the role of HSPB1 in AH pathophysiology.

Methods: Serum HSPB1 was measured in a retrospective study of 184 healthy controls (HCs), heavy alcohol consumers (HA), patients with alcohol-associated cirrhosis (AC), and patients with AH recruited from major hospital centers.HSPB1 was also evaluated in liver tissue from HC and AH patients, existing RNA-seq data from ALD patient liver and monocytes, and livers from mice fed a Lieber-DeCarli diet. Cellular models of hepatocyte and macrophage interactions were used to evaluate the role of HSPB1 in inflammation during AH.

Results: Circulating HSPB1 was significantly increased in AH patients, and levels positively correlated with disease-severity scores. HSPB1 was also increased in the livers of patients with severe AH and ethanol-fed mice. In cellular models, ethanol-stressed hepatocytes released HSPB1, which then triggered TNFα-mediated inflammation in macrophages. Anti-HSPB1 antibody prevented TNFα release from macrophages exposed to media conditioned by ethanol-stressed hepatocytes.

Conclusions: Our findings support investigation of HSPB1 as both a biomarker and therapeutic target in ALD. Furthermore, this work demonstrates that anti-HSPB1 antibody is a rational approach to targeting HSPB1 with the potential to block inflammation and protect hepatocytes, without inactivating host defense.

Keywords: TNFα; alcohol-associated liver disease; heat shock protein 27; hepatocyte; macrophage.


Conflict of interest statement

Chelsea Finney is employed by Boehringer Ingelheim. Srinivasan Dasarathy received grants from NIH. Daniel Rotroff consults and owns stock in Clarified Precision Medicine and Genovation Health LLC. Adam Schmitt owns stock and is employed by Arinale Biosciences. He consults for AstraZeneca. The remaining authors have no conflicts to report.

Figures

None
Graphical abstract
FIGURE 1
FIGURE 1
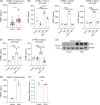
Circulating HSPB1 is increased in ALD patients. (A) Violin plot of HSPB1 concentration in patient sera measured by ELISA. (B) Linear regression of HSPB1 concentration and Child–Pugh score of AC patients. HSPB1 concentration in AC patients with mild-moderate (≤8) versus severe (>8) disease scores (Child–Pugh). (C) Linear regression of HSPB1 concentration versus MELD score of AH patients. HSPB1 concentration in AH patients with mild-moderate (≤22) versus severe (>22) disease scores (MELD). (D) Linear regression of HSPB1 concentration versus age in all patients. (E) HSPB1 concentration in male versus female patients. (F) Phosphorylated HSPB1 concentration in patient sera measured by ELISA. All data plotted as mean ± SD. (A, F) Kruskal–Wallis test with a Dunn multiple comparisons post hoc test. (B, C, D) Simple linear regression. (B, C, E) Mann–Whitney test. n.s. p>0.05, *p≤0.05, **p≤0.01, ***p≤0.001, and ****p≤0.0001. Abbreviations: AC, alcohol-associated cirrhosis; AH, alcohol-associated hepatitis; HA, high alcohol consumer; HC, healthy control.
FIGURE 2
FIGURE 2
HSPB1 is increased in the liver of patients with AH. (A) HSPB1 gene expression in RNA-seq analysis of liver from HC, AH, AC, HCV, and MASLD. (B) Forrest plot depicting Log2 fold changes in HSPB1 expression in samples described in (A). Patients with various types of liver disease were compared to HC or patients with severe AH. (C) IB for HSPB1 and GAPDH in HC and AH liver samples. HSPB1 protein concentration relative to GAPDH as measured by densitometry in immunoblot. (D) IF staining for HSPB1 (red) and Hoechst (blue) in liver biopsies from HC and AH liver samples. Staining intensity measured using ImageJ. Data plotted as mean ± SEM in (A) and (B). Data plotted as mean ± SD in (C) and (D). (A, B) Differential gene expression analysis was performed using DESeq2. (C, D) Mann–Whitney test. n.s. p>0.05, * p≤0.05, ** p≤0.01, *** p≤0.001, and **** p≤0.0001. Abbreviations: AH, alcohol-associated hepatitis; HC, healthy controls; IB, immunoblotting; IF, Immunofluorescent; MASLD, metabolic dysfunction–associated with steatotic liver disease; TPM, transcripts per million.
FIGURE 3
FIGURE 3
Ethanol consumption increases HSPB1 in murine liver. (A) Illustration of murine model of CAC. (B) Relative gene expression of HSPB1 in the liver of Pair and EtOH mice measured by qRT-PCR. (C) HSPB1 concentration in the liver of Pair and EtOH mice measured by ELISA. (D) IF for HSPB1 (yellow) and DNA (Hoechst, blue) in Pair and EtOH mice. Scale bar = 100 μm. Images are focused on periportal hepatocytes or pericentral hepatocytes. High-magnification image of HSPB1 (yellow) and DNA (Hoechst, blue) immunofluorescence in the liver of EtOH mice is also provided. Scale bar = 50 μm. Images are representative of 12 Pair and 11 EtOH mice. (E) Linear regression analysis of liver HSPB1 and triglycerides, AST, or ALT from Pair and EtOH mice. Data are plotted as mean ± SD. (B, C) Unpaired t test. (E) Simple linear regression. n.s. p>0.05, *p≤0.05, **p≤0.01, ***p≤0.001, and ****p≤0.0001. Abbreviations: CAC, chronic alcohol consumption; EtOH, ethanol-fed mice; IF, immunofluorescent; Pair, pair-fed mice; qRT-PCR, quantitative reverse transcription polymerase chain reaction; TG, triglycerides.
FIGURE 4
FIGURE 4
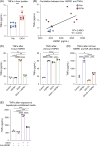
HSPB1 is increased in EtOH-stressed hepatocytes and released into the extracellular environment. (A) Extracellular HSPB1 concentration by ELISA in culture media of liver tissue challenged with 500 mM (3%) EtOH for 2 hours. (B) Extracellular HSPB1 concentration measured by ELISA in cell media from hepatocytes exposed to vehicle control, 5 mM 4-MP, 250 mM EtOH, or 250 mM EtOH and 5 mM 4-MP for 1 (HepG2 and AML-12) or 24 (THLE-2) hours. (C) Extracellular HSPB1 concentration measured by ELISA in cell media from hepatocytes exposed to vehicle control, 5 mM NAC, 250 mM EtOH, or 250 mM EtOH and 5 mM NAC for 1 (HepG2) or 24 (THLE-2) hours. (D) IB for HSBP1 and GAPDH in HepG2 cells exposed to vehicle control or 250 mM (1.5%) EtOH for 1 hour. (E) Intracellular HSPB1 concentration by ELISA in cell lysates of HepG2 cells exposed to vehicle control or 250 mM EtOH for 1 hour. (F) HSPB1 gene expression relative to GAPDH in HepG2 cells exposed to vehicle control or 250 mM EtOH for 1 hour by qRT-PCR. Data are plotted as mean ± SD. (A, E, F) Unpaired t test. (B, C) One-way ANOVA with a Tukey multiple comparisons post hoc test. n.s. p>0.05, * p≤0.05, ** p≤0.01, *** p≤0.001, and **** p≤0.0001. Abbreviations: 4-MP, 4-methylpyrazole; EtOH, ethanol; IB, immunoblotting; NAC, N-acetyl cysteine; qRT-PCR, quantitative reverse transcription polymerase chain reaction.
FIGURE 5
FIGURE 5
Extracellular HSPB1 promotes liver-damaging inflammation. (A) TNFα concentration in liver lysates from Pair and EtOH mice measured by ELISA. (B) Linear regression analysis of liver HSPB1 and TNFα in Pair and EtOH mice. (C) TNFα concentration measured in media of RAW264.7 cells after 1 or 24 hours of treatment with 3 μM HSPB1, 250 mM (1.5%) EtOH, or both 250 mM EtOH and 3 μM HSPB1 by ELISA. (D) TNFα concentration measured in media of RAW264.7 cells after 24 hours of treatment with 3 μM HSPB1, 30 μM JSH-23, or both 3 μM HSPB1 and 30 μM JSH-23 by ELISA. (E) TNFα concentration in media of RAW264.7 cells after exposure to EtOH-stressed HepG2 (250 mM EtOH for 24 h) conditioned media with or without 250 mg/mL anti-HSPB1 antibody, measured by ELISA. Data are plotted as mean ± SD. (A) Unpaired t test. (B) Simple linear regression. (C, D, E) One-ANOVA with a Tukey multiple comparisons post hoc test. n.s. p>0.05, * p≤0.05, ** p≤0.01, *** p≤0.001, and **** p≤0.0001. Abbreviation: EtOH, ethanol.

Update of

References

    1. Centers for Disease Control and Prevention (CDC). Spencer MR, Curtin SC, Garnett MF. Alcohol-induced Death Rates in the United States, 2019–2020. NCHS Data Briefs. Hyattsville, MD; 2022. 10.15620/cdc:121795. - DOI - PubMed
    1. Niu X, Zhu L, Xu Y, Zhang M, Hao Y, Ma L, et al. Global prevalence, incidence, and outcomes of alcohol related liver diseases: A systematic review and meta-analysis. BMC Public Health. 2023;23:859. - PMC - PubMed
    1. Yamazaki T, Schnabl B. Acute alcohol-associated hepatitis: Latest findings in non-invasive biomarkers and treatment. Liver Int. 2025;45:e15608. - PMC - PubMed
    1. Mackowiak B, Fu Y, Maccioni L, Gao B. Alcohol-associated liver disease. J Clin Invest. 2024;134. - PMC - PubMed
    1. Ju C, Tacke F. Hepatic macrophages in homeostasis and liver diseases: From pathogenesis to novel therapeutic strategies. Cell Mol Immunol. 2016;13:316–327. - PMC - PubMed

MeSH terms