. 2025 Aug 29;20(8):e0331320.
doi: 10.1371/journal.pone.0331320. eCollection 2025.

Evaluation of methods for the measurement of antibody-dependent enhancement of dengue virus infection using different FcγRIIa expressing cell lines

Affiliations

Evaluation of methods for the measurement of antibody-dependent enhancement of dengue virus infection using different FcγRIIa expressing cell lines

Shweta Chelluboina et al. PLoS One. .

Abstract

Background: Pre-existing dengue antibodies could potentially exacerbate disease severity through antibody-dependent enhancement (ADE). Current serological assays focus on measuring neutralizing antibodies for vaccine evaluation, but don't measure sub-neutralizing antibodies that enhance infection via Fcγ receptors. Consensus on a standardized system for measuring dengue virus ADE remains elusive.

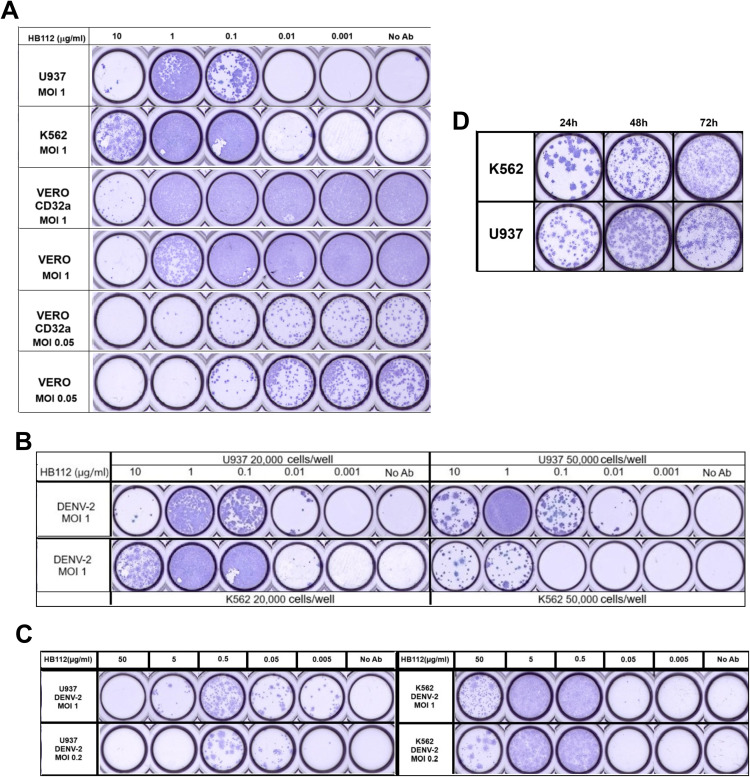
Methods: In this study, we compared and evaluated ADE responses using two different methodologies in healthy blood donors (n = 12) and secondary dengue patients' (n = 12) samples with pre-existing IgG antibodies to dengue virus (DENV). We performed an ADE-infection assay in FcγRIIa-expressing U937, K562, and Vero-CD32a cells. Foci-reduction neutralization test (FRNT) was performed simultaneously in Vero and Vero-CD32a cells, and reduction in neutralization titres was examined in Vero-CD32a cells.

Results: Out of 12 blood donors, all 9 anti-dengue IgG-positive donors demonstrated ADE through infection-enhancement assay against DENV-2 and DENV-4 serotypes in U937 and K562 cells, but not in Vero-CD32a cells. None of the anti-dengue IgG-negative donor samples exhibited ADE against DENV in all three cell lines. Fold-enhancement of DENV-2 infection was comparable in the two cell lines whereas, fold-enhancement of DENV-4 infection was significantly higher in K562 than in U937 cells. Comparable neutralizing antibody titres in Vero and Vero-CD32a cells against DENV-2 and DENV-4 serotypes suggest that donor samples did not exhibit any enhancing activity in Vero-CD32a cells. Comparable DENV-2 titres and significantly lower DENV-4 titres were obtained in Vero-CD32a than in Vero cells in secondary dengue patient samples, indicating that enhancing activity was influenced by DENV serotypes.

Conclusion: In summary, infection-enhancement assay using K562 cells was superior to U937 and Vero-CD32a cells in evaluating ADE. Samples with high neutralizing activity demonstrated very low levels of infection-enhancing activity in Vero-CD32a cells. Comparison of FRNT titres in Vero and Vero-CD32a cells is not suitable for detecting ADE. Our findings suggest that infection-enhancing activities are apparent at sub-neutralizing concentrations of dengue virus antibodies in all individuals exposed to dengue virus.


Conflict of interest statement

The authors have declared that no competing interests exist.

Figures

Fig 1
Fig 1. (A) Representative flow cytometry plots showing the percentage of CD32a+ cells in K562, U937, Vero-CD32a, and Vero CCL-81 cells.
(B) A line graph of the percentage of CD32a+ cells indicates a decline in the expression of CD32a with an increase in the passage number of Vero-CD32a cells.
Fig 2
Fig 2. (A) Comparison of infection enhancement patterns from supernatants collected from the wells incubating mixtures of different concentrations of HB112 antibody with DENV-2 virus.
HB112 antibody and DENV-2 virus at MOI 1 mixture were incubated with U937 and K562 cells for 24 hours. HB112 antibody and DENV-2 virus at MOI 1 and MOI 0.05 mixture were incubated with Vero-CD32a and Vero cells for 24 hours. (B) Comparison of infection enhancement patterns among different cell densities of 20,000 and 50,000 cells/well. Supernatants were collected from the wells incubating different concentrations of HB112 antibody with DENV-2 virus at MOI 1, incubated with U937 and K562 cells for 24 hours. (C) Comparison of infection enhancement patterns in two cell lines, U937 and K562, seeded at 20,000 cells/well. Supernatants were collected from mixtures of different concentrations of HB112 antibody with DENV-2 virus at MOI 1 and MOI 0.2, incubated for 24 hours. (D) Comparison of the foci morphology at different time points. Supernatants were collected from mixtures of DENV-2 at MOI 1 and 1 µg/ml of HB112 incubated with K562 and U937 cells at 24-, 48-, and 72-hours post-infection.
Fig 3
Fig 3. A plot of average foci counts across concentrations of HB112 at different MOIs of DENV-2 and DENV-4 virus in both U937 and K562 cells.
A virus control panel indicates the number of foci obtained in virus control wells without any antibody mixture in the respective cells. The top panel indicates DENV-2 virus infection enhancement in (A) U937 and (B) K562 cells, whereas the bottom panel indicates DENV-4 virus infection enhancement in (C) U937 and (D) K562 cells.
Fig 4
Fig 4. A scatter plot of log10 virus titers (ffu/ml) at different dilutions (1:20 to 1:20,000) of 12 healthy donor plasma samples.
Data is presented as geometric mean titers with 95% CI as error bars. The enhancement of infection for DENV-2 virus was observed in (A) K562, (B) U937, and (C) Vero-CD32a cells. The enhancement of infection for DENV-4 virus was observed in (D) K562, (E) U937, and (F) Vero-CD32a cells. The dotted line indicates the cut-off value above which fold enhancement was seen at different dilutions. At different sample dilutions, the virus titer was normalized by the average virus titer in virus control wells. A dot plot of the magnitude of fold enhancement in terms of log10 of virus titers, ffu/ml among 12 healthy donor samples for (G) DENV-2 and (H) DENV-4 viruses in K562, U937, and Vero-CD32a cells. The cut-off value was calculated from the mean values of three IgG-negative samples, and it was assigned a zero value on Y-axis since IgG-negative samples showed no fold-enhancement. The Wilcoxon signed-rank test was used for paired analyses. *indicates p-value <0.01, ** indicates p-value <0.001.
Fig 5
Fig 5. Replication kinetics of DENV-2 & DENV-4 in Vero and Vero-CD32a cell lines.
Vero and Vero-CD32a cells were infected with (A) DENV-2 & (B) DENV-4 viruses at 0.1 MOI, and the culture supernatants harvested at different time points post-infection were analyzed for viral titers. Virus titers were determined by focus-forming assay on Vero cells. The line graph indicates the mean ± SD viral titers from three replicates. (C) The image compares the morphology of foci obtained in Vero and Vero-CD32a cells at different time points post-infection with DENV-2 and DENV-4 viruses.
Fig 6
Fig 6. Scatter plot of log10 FRNT50 titres of 21 samples (9 healthy blood donors and 12 secondary dengue patients) for (A & B) DENV-2 and (C & D) DENV-4 in Vero and Vero-CD32a cells, respectively.
Low input VC denotes an input of 500-700 ffu/ml, yielding 20-30 foci in virus control wells, and high input VC denotes an input of 1000-1200 ffu/ml, yielding 45-70 foci in virus control wells. A paired t-test was used for analyses.
Fig 7
Fig 7. A line graph of log10 FRNT50 titres of 12 healthy blood donor samples (9 dengue IgG-positive and 3 dengue IgG-negative samples) for (A) DENV-2 and (B) DENV-4 in Vero and Vero-CD32a cells.
The dotted line denotes a baseline showing geometric mean titres from three dengue IgG-negative samples. The data represents three independent experiments. Two-tailed P values were estimated by the Wilcoxon matched-pairs signed-rank test.
Fig 8
Fig 8. A scatter plot of log10 virus titers (ffu/ml) at different dilutions (1:20 to 1:20,000) of 12 secondary dengue patient samples.
The enhancement of infection for (A) DENV-2 and (B) DENV-4 viruses was observed in K562 cells. Data is presented as geometric mean titers with 95% CI as error bars. The dotted line indicates the cut-off value above which fold enhancement was seen at different dilutions. (C) Comparison of log 10 of fold enhancement of DENV-2 and DENV-4 infections in secondary dengue patient samples. A line graph of log10 FRNT50 titres of 12 secondary dengue samples for (D) DENV-2 and (E) DENV-4 in Vero and Vero-CD32a cells. Two-tailed P values were estimated by the Wilcoxon matched-pairs signed-rank test.

References

    1. Bhatt S, Gething PW, Brady OJ, Messina JP, Farlow AW, Moyes CL, et al. The global distribution and burden of dengue. Nature. 2013;496(7446):504–7. doi: 10.1038/nature12060 - DOI - PMC - PubMed
    1. Stanaway JD, Shepard DS, Undurraga EA, Halasa YA, Coffeng LE, Brady OJ, et al. The global burden of dengue: an analysis from the Global Burden of Disease Study 2013. Lancet Infect Dis. 2016;16(6):712–23. doi: 10.1016/S1473-3099(16)00026-8 - DOI - PMC - PubMed
    1. Mutheneni SR, Morse AP, Caminade C, Upadhyayula SM. Dengue burden in India: recent trends and importance of climatic parameters. Emerg Microbes Infect. 2017;6(8):e70. doi: 10.1038/emi.2017.57 - DOI - PMC - PubMed
    1. Halstead SB. Neutralization and antibody-dependent enhancement of dengue viruses. Adv Virus Res. 2003;60:421–67. doi: 10.1016/s0065-3527(03)60011-4 - DOI - PubMed
    1. Rodrigo WWSI, Jin X, Blackley SD, Rose RC, Schlesinger JJ. Differential enhancement of dengue virus immune complex infectivity mediated by signaling-competent and signaling-incompetent human Fcgamma RIA (CD64) or FcgammaRIIA (CD32). J Virol. 2006;80(20):10128–38. doi: 10.1128/JVI.00792-06 - DOI - PMC - PubMed

MeSH terms