. 2025 Aug 29;11(35):eadw8260.
doi: 10.1126/sciadv.adw8260. Epub 2025 Aug 29.

Nitrogen status exerts dynamic control over phosphorus sensing and acquisition via PSR1 in colimited marine diatoms

Affiliations

Nitrogen status exerts dynamic control over phosphorus sensing and acquisition via PSR1 in colimited marine diatoms

Ellen Harrison et al. Sci Adv. .

Abstract

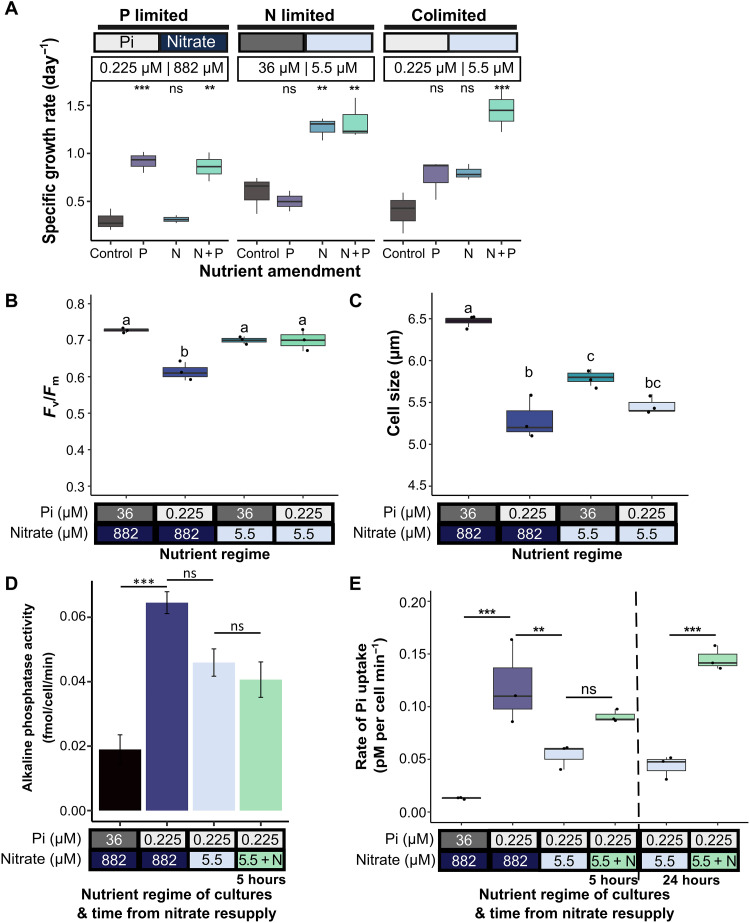
Nutrient availability controls phytoplankton growth in aquatic ecosystems globally. Phytoplankton frequently experience a limiting supply of multiple nutrients simultaneously (colimitation). Ocean warming is predicted to exacerbate marine nutrient limitation. Yet, how phytoplankton adapt their physiology and regulate responses to colimitation is poorly understood. Here, we show that when the crucial macronutrients nitrogen (N) and phosphorus (P) colimit growth of globally abundant phytoplankton, the diatoms, cellular resources are diverted to prioritize N uptake over P sensing and acquisition. Regulatory mechanisms for responding to fluctuating P supply, including Phosphate Starvation Response 1 (PSR1) and P-resupply sensing via Ca2+ signaling, are strictly nitrate dependent. Further, P-Ca2+ signaling is impaired in psr1 mutants, suggesting that PSR1 is necessary for this response and coordinates adaptations to colimitation. Our study demonstrates a hierarchy of resource allocation during colimitation that points to N starvation mechanisms overriding those of P and could lead to N-P colimitation being masked in many marine ecosystems.


Figures

Fig. 1.
Fig. 1.. Determining P and N colimiting conditions for P. tricornutum.
(A) Specific growth rate (day−1) of P. tricornutum (strain PtR1) grown on f/2 medium with different concentrations of phosphate (Pi): 0, 1.8, 3, 6, 12, 18, and 36 μM. The growth rate was calculated during exponential growth phase, between 2 and 4 days (n = 3, ±SEM). (B) As in (A), but cultures were grown on one of three Pi concentrations (1.8 μM in turquoise, 12 μM in navy blue, and 36 μM in black) but with various levels of nitrate, ranging from 0 to 882 μM (n = 3, ±SEM). (C) Nutrient amendment experiments with 4-day-old cultures grown in low Pi (1.8 μM) with varying nitrate levels between 22 and 882 μM. Cultures were grown with the addition of Pi (P, 36 μM), nitrate (N, 882 μM), nitrate and Pi (N + P), or with no supplementation (control) and changes in chlorophyll autofluorescence [relative fluorescence units (RFU)] over time shown as a proxy for growth (n = 3, ±SD). (D) The specific growth rate was calculated between days 0 and 3 after amendment of cultures shown in (C) (n = 3). Asterisks indicate results of Dunn post hoc test of addition treatments compared to the control: *P < 0.05 and **P < 0.01; “ns” indicates that the result was not significant. (E) Photosynthetic efficiency of photosystem II (Fv/Fm) of cells grown in various nutrient regimes for 4 days (n = 3). Letters indicate statistically significant groups, Dunn post hoc test, P ≤ 0.05. (F) Cell size (micrometers) of cells grown in various nutrient regimes for 4 days, measured using LUNA-FX7 (Logos Biosystems) (n = 3). Line indicates the only statistically significant comparison between high nitrate (882 μM) low phosphate (1.8 μM) and low nitrate (44 μM) high phosphate (36 μM), Tukey post hoc test, P ≤ 0.05.
Fig. 2.
Fig. 2.. P and N colimited P. tricornutum cells grown in batch culture show a reduced capacity for P-Ca2+ signaling.
(A to D) Example fluorescence traces of PtR1 cells grown in different nutrient regimes and exposed to either phosphate (Pi) resupply (36 μM Pi) stimulus or an 80% ASW osmotic shock, after 4 days of growth. Cells were deemed to have responded if the [Ca2+]cyt fluorescence signal was above the F/F0 threshold of 1.15, indicated by the dashed horizontal line. (E) The maximal fluorescence (F/F0) of all cells analyzed to Pi resupply or osmotic shock, 1.15 threshold indicated by a dashed horizontal line. Asterisks indicate the Student’s t test result of Pi resupply responses in the different nutrient regimes compared to that of the P-limited only cells (1.8 μM Pi; 882 μM nitrate): ****P < 0.0001; ns indicates that the result was not significant. (F) Percentage of P. tricornutum PtR1 cells that respond to either stimulus, with at least 12 cells per replicate analyzed. Error bars indicate the SEM of three replicates.
Fig. 3.
Fig. 3.. P-Ca2+ signaling response is restored within 2 hours following nitrate resupply to N and P colimited cells.
(A) Time-course following nitrate resupply to 5-day-old N and P colimited cultures either grown in low Pi (1.8 μM) and 44 or 22 μM nitrate, showing the percentage of cells which respond to a Pi resupply (36 μM) stimulus, using a maximal fluorescence (F/F0) of 1.15 as the threshold for responding. Experiment performed on three sets of independently grown cultures per treatment, with at least 12 cells per replicate analyzed. Error bars show the SEM of three replicates. (B) Maximal fluorescence (F/F0) to Pi resupply of cells during the experimental time course. The horizontal line indicates 1.15 F/F0 threshold, and asterisks indicate the Student’s t test result compared to time point 0 (B) with P values described as follows: *P < 0.05, **P < 0.01, ***P < 0.001, and ****P < 0.0001; ns indicates that the result was not significant. (C) The control experiments, showing the percentage of cells that respond to Pi resupply when grown in low Pi (1.8 μM) high nitrate (882 μM) and the two colimited conditions at time point 0 and 24 hours later without nitrate resupply. (D) Corresponding maximal fluorescence (F/F0) to Pi resupply for the control experiments described in (C), the horizontal line indicates 1.15 F/F0 threshold, and asterisks indicate the Student’s t test result compared to low Pi high nitrate control P values described previously.
Fig. 4.
Fig. 4.. Dynamic control of P scavenging and acquisition by N availability in P. tricornutum and distinct colimitation physiologies.
(A) Alkaline phosphatase activity (fmol/cell per min) of cells grown in f/2, low Pi (1.8 μM) high nitrate (882 μM), low Pi (1.8 μM) low nitrate (44 or 22 μM), or low Pi low nitrate resupplied with 882 μM nitrate 24 hours post-resupply (n = 3, ±SEM). Lines indicate statistical comparisons, and asterisks indicate the results of a Dunn post hoc test, P values described as follows: *P < 0.05 and **P < 0.01; ns indicates that the result was not significant. (B) Pi remaining in media fraction after Pi resupply (36 μM) to cells grown in various Pi and nitrate regimes (n = 3, ±SEM). (C) Rate of Pi uptake (picomolars per cell per minute) calculated between 30 and 120 min after Pi resupply (Fig. 4B). Pi uptake rates following nitrate resupply (882 μM) to low Pi (1.8 μM) low nitrate (44 μM) grown cells after 4, 6, and 24 hours, are also shown. Cells grown for 4 days and density normalized to 2 × 106 cell/ml, before resupply n = 3, statistics displayed as in (A). Vertical dashed line to highlight measurements repeated 24 hours later for those samples. (D) Nitrate remaining in the media fraction after 300 μM nitrate resupply to cells grown in different nutrient regimes and cell density normalized ~8 × 106 cell/ml, n = 4. Lines are fitted using nonlinear regression equation f = a × exp(−b × x). (E) Rate of nitrate uptake (picomolars per cell per minute) calculated between 1 and 3 hours for N-limited and colimited cells, 3 and 24 hours for replete cells, and 3 and 50 hours for P-limited cells, n = 4, statistics displayed as in (A). (F) Percent change in phosphate or nitrate uptake rates compared to replete cells for single-nutrient limitation and colimited cells.
Fig. 5.
Fig. 5.. Expression of P starvation signaling master regulator PtPSR1 is governed by N availability.
(A) Localization of PtPSR1-mVenus in P. tricornutum grown in f/2, low Pi (1.8 μM) high nitrate (882 μM) and low Pi (1.8 μM) low nitrate (22 μM), mVenus in yellow and chlorophyll in red. (B) Normalized fluorescence [mVenus RFU/chlorophyll (Chl) RFU] of P. tricornutum transformed with PtPSR1-mVenus reporter construct, grown in f/2 (36 μM PI, 882 μM nitrate) or low Pi (1.8 μM) with varying levels of nitrate (22-882 μM) after 4 days of growth (n = 4, ±SEM). (C) Localization of PtPSR1-mVenus in colimited cells over time with or without 882 μM nitrate resupply. Scale bars, 30 μm. (D) Mean mVenus fluorescence (RFU) per cell depending on nutrient regime and N resupply over 24 hours, at least eight cells per replicate analyzed with experiment performed on three sets of independently grown cultures per treatment (n ≥ 30).
Fig. 6.
Fig. 6.. Ptpsr1 mutants show impaired P-Ca2+ signaling.
(A) Example traces of Ca2+ elevations in cells grown in replete (36 μM) or low (1.8 μM) Pi media for 4 days when resupplied with phosphate (Pi 36 μM, gray arrow). (B) Maximal fluorescence intensity after Pi resupply of all cells (n) tested on day 4 and day 6 for cells grown in low P medium only. Asterisks indicate the Student’s t test result compared to WT with P values described as follows: ****P < 0.001; ns indicates that the result was not significant. Experiments were performed on three sets of independently grown cultures per treatment, with at least nine cells per replicate analyzed. All three P. tricornutum strains were transformed with the R-GECO1–mTurquoise (RGMT) Ca2+ indicator, and fluorescence was normalized (R/R0) as described in the Materials and Methods.
Fig. 7.
Fig. 7.. Regulation of P scavenging and phosphate uptake by N availability in the centric diatom Thalassiosira pseudonana.
(A) Nutrient amendment experiments with cultures grown in a semicontinuous manner in low Pi (0.225 μM) medium with varying nitrate levels of 5.5 or 882 μM or in low nitrate (5.5 μM) and high phosphate (36 μM). Cultures were grown with the addition of Pi (P), nitrate (N), nitrate and Pi (N + P), or with no supplementation (control). The growth rate was calculated during exponential growth. Asterisks indicate the result of Tukey post hoc test only of an addition compared to the control: **P < 0.01 and ***P < 0.001; ns indicates that the result was not significant (n = 3). (B) Photosynthetic efficiency of photosystem II (Fv/Fm) of cells grown in various nutrient regimes semicontinuously (n = 3). Letters indicate statistically significant groups, Tukey post hoc test, P ≤ 0.001. (C) Cell size (micrometers) of cells grown in various nutrient regimes grown semicontinuously measured using LUNA-FX7 (Logos Biosystems) (n = 3). Letters indicate statistically significant groups, Tukey post hoc test, P ≤ 0.05. (D) Alkaline phosphatase activity (femtomoles per cell per minute) of cultures grown in N and Pi regimes after 10 days, N was resupplied to colimited cells, and alkaline phosphatase activity was measured after 5 hours (n = 3, ±SEM). Lines indicate statistical comparisons and asterisks the result of Tukey post hoc test, P values described as follows: **P < 0.01 and ***P < 0.001. (E) Rate of Pi uptake (picomolars per cell per minute) calculated between 60 and 150 min after Pi resupply (n = 3), statistics displayed as in (D). Vertical dashed line to highlight that uptake rate experiments were carried out again 24 hours later on those samples.

Similar articles

References

    1. Browning T. J., Moore C. M., Global analysis of ocean phytoplankton nutrient limitation reveals high prevalence of co-limitation. Nat. Commun. 14, 5014 (2023). - PMC - PubMed
    1. Moore C. M., Mills M. M., Arrigo K. R., Berman-Frank I., Bopp L., Boyd P. W., Galbraith E. D., Geider R. J., Guieu C., Jaccard S. L., Jickells T. D., La Roche J., Lenton T. M., Mahowald N. M., Marañón E., Marinov I., Moore J. K., Nakatsuka T., Oschlies A., Saito M. A., Thingstad T. F., Tsuda A., Ulloa O., Processes and patterns of oceanic nutrient limitation. Nat. Geosci. 6, 701–710 (2013).
    1. Wu J., Sunda W., Boyle E. A., Karl D. M., Phosphate depletion in the Western North Atlantic Ocean. Science 289, 759–762 (2000). - PubMed
    1. Thingstad T. F., Krom M. D., Mantoura R. F. C., Flaten G. A. F., Groom S., Herut B., Kress N., Law C. S., Pasternak A., Pitta P., Psarra S., Rassoulzadegan F., Tanaka T., Tselepides A., Wassmann P., Woodward E. M. S., Riser C. W., Zodiatis G., Zohary T., Nature of phosphorus limitation in the ultraoligotrophic Eastern Mediterranean. Science 309, 1068–1071 (2005). - PubMed
    1. Ly J., Philippart C. J. M., Kromkamp J. C., Phosphorus limitation during a phytoplankton spring bloom in the western Dutch Wadden Sea. J. Sea Res. 88, 109–120 (2014).

LinkOut - more resources