. 2025 Aug 29;11(35):eadw0128.
doi: 10.1126/sciadv.adw0128. Epub 2025 Aug 29.

Cytoskeletal control in adult microglia is essential to restore neurodevelopmental synaptic and cognitive deficits

Affiliations

Cytoskeletal control in adult microglia is essential to restore neurodevelopmental synaptic and cognitive deficits

Sofie Kessels et al. Sci Adv. .

Abstract

Synaptic dysfunction is a hallmark of neurodevelopmental disorders (NDDs), often linked to genes involved in cytoskeletal regulation. While the role of these genes has been extensively studied in neurons, microglial functions such as phagocytosis are also dependent on cytoskeletal dynamics. We demonstrate that disturbance of actin cytoskeletal regulation in microglia, modeled by genetically impairing the scaffold protein Disrupted-in-Schizophrenia 1 (DISC1), which integrates actin-binding proteins, causes a shift in actin regulatory balance favoring filopodial versus lamellipodial actin organization. The resulting microglia-specific dysregulation of actin dynamics leads to excessive uptake of synaptic proteins. Genetically engineered DISC1-deficient mice show diminished hippocampal excitatory transmission and associated spatial memory deficits. Reintroducing wild-type microglia-like cells via bone marrow transplantation in adult DISC1-deficient mice restores the synaptic function of neurons and rescues cognitive performance. These findings reveal a pivotal role for microglial actin cytoskeletal remodeling in preserving synaptic integrity and cognitive health. Targeting microglial cytoskeletal dynamics may effectively address cognitive impairments associated with NDDs, even in adulthood.


Figures
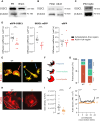
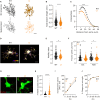
Fig. 1.
Fig. 1.. The actin cytoskeleton in microglia is disrupted by DISC1 deficiency.
DISC1 levels in (A) mouse primary microglia and whole brain lysates, (B) fetal and adult human microglia, and (C) human iMicroglia. PM, primary microglia. (D) BV2 cells, comagnetofected with N- or C-terminal eGFP-tagged DISC1 and mCherry-LifeAct, were incubated with SPY650-tubulin to determine the diffusion coefficient of eGFP-tagged DISC1 in cytoskeleton-free cellular regions and actin-rich regions. n = 10 per condition. Data points represent individual microglia. Horizontal bars indicate the median. Shapiro-Wilk test followed by the two-tailed Mann-Whitney U test. (E) Representative F-actin (red) and β-tubulin (yellow)–stained Disc1WT/WT and Disc1LI/LI primary microglia. Scale bar, 25 μm. (F) Schematic overview of three categories of microglial morphologies based on actin-rich protrusions (lamellipodia area in red). Colored arrows in (E) indicate an example per protrusion type: cells with large round lamellipodia (red), small spikey filopodia (blue), and intermediate shapes (green). (G) Proportion of different protrusion-based morphologies. Fisher’s exact test. F, filopodia; I, intermediate; L, lamellipodia. (H) Representative phalloidin staining in Disc1WT/WT and Disc1LI/LI primary microglia. The yellow arrow indicates the actin cortex in Disc1WT/WT cells. White lines indicate cross sections of lamellipodia used for analysis in (J). Scale bar, 10 μm. (I) Total F-actin density was quantified and normalized using the corrected total cell fluorescence (CTCF) method. n = 15 per genotype. Data points represent individual microglia. Horizontal bars indicate the median. Shapiro-Wilk test followed by the two-tailed Mann-Whitney U test. (J) F-actin density was measured over binarized cross sections of primary microglia lamellipodia. n = 15 per genotype. Data are reported as mean ± SEM. Shapiro-Wilk test followed by two-way analysis of variance (ANOVA) with Šidák’s multiple comparisons test. Filled data points indicate significant differences (P < 0.001) from the equidistant value in WT. *P < 0.05, **P < 0.01, ***P < 0.001, and ****P < 0.0001
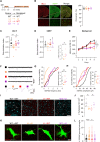
Fig. 2.
Fig. 2.. DISC1 differentially regulates F-actin rearrangements in microglial filopodia and lamellipodia.
(A) Representative SIM images of F-actin structures observed in Disc1WT/WT and Disc1LI/LI primary microglia transduced with LifeAct-mScarlet lentivirus. Scale bar, 10 μm. Green and red colors represent the displacement between two consecutive images taken 5 min apart, with one region of interest (ROI) shown in the right panel. Scale bar, 1 μm. (B) Total lamellipodia displacement of Disc1WT/WT and Disc1LI/LI primary microglia. (C) Representative SIM images of F-actin structures observed in Disc1WT/WT and Disc1LI/LI primary microglia transduced with LifeAct-mScarlet lentivirus. Scale bar, 10 μm. Green and red colors represent the displacement between two consecutive images taken 3 min apart, with one ROI shown in the second panel. Scale bar, 1 μm. PIVlab-generated heat maps of particle vector velocity calculation are shown in the right panel. The color-coded bar indicates the range of vector velocity magnitude. (D) Mean vector velocity values of all interrogation areas of the representative Disc1WT/WT and Disc1LI/LI primary microglia shown in (C). (E) Representative images of immunocytochemical staining of Formin1 in Disc1WT/WT and Disc1LI/LI primary microglia. Scale bar, 10 μm. (F) Fold change (FC) quantification of Formin1 mean fluorescence intensity (MFI) in Disc1WT/WT and Disc1LI/LI primary microglia. Data points represent individual microglia. [(B) and (D)] Data points represent individually analyzed ROIs of different images (n = 20 regions per condition, from three independent experiments). Shapiro-Wilk test followed by (B) two-tailed unpaired t test or [(D) and (F)] two-tailed Mann-Whitney U test. *P < 0.05, ***P < 0.001, and ****P < 0.0001
Fig. 3.
Fig. 3.. Disruption of actin cytoskeleton signaling impairs phagocytic and motility capacity in Disc1 LI microglia.
(A) Uniform manifold approximation and projection (UMAP) analysis of 6072 Disc1WT/WT and 2040 Disc1LI/LI microglia from 23-week-old mice grouped into five clusters. Each dot represents a cell, color-coded by cluster affiliation. (B) UMAP illustrates the distribution of microglia among Disc1WT/WT and Disc1LI/LI genotypes. A differential abundance analysis shows the percentage of cells in each cluster for both genotypes, revealing cluster Mg1 as the most abundant in Disc1LI/LI mice, while they lack cluster Mg2. (C) Volcano plot depicting differentially expressed genes (DEGs) in Disc1LI/LI versus Disc1WT/WT microglia. The y axis indicates the statistical significance [false discovery rate (FDR)–adjusted P value], with up-regulated genes highlighted in red and down-regulated genes in blue. Genes surpassing the significance threshold (adjusted P < 0.05) are considered statistically significant. (D) Ingenuity Pathway Analysis (IPA) prediction of selected canonical pathways that are significantly deregulated in Disc1LI/LI microglia. ERK, extracellular signal–regulated kinase; MAPK, mitogen-activated protein kinase. (E) Gene expression (log10) for distinct marker genes related to phagosome formation, actin cytoskeleton signaling, and complement cascade pathways was compared between Disc1WT/WT and Disc1LI/LI microglia. Data points represent individual cells. cytos., cytoskeleton. (F) Quantitative polymerase chain reaction (qPCR) analysis of complement genes C1qa, C1qb, and C1qc in Disc1WT/WT and Disc1LI/LI microglia isolated from adult mice. Fold change (FC) data are represented as mean ± SEM from three independent experiments. Two-way ANOVA with Tukey’s multiple comparisons test. (G) Representative images of a C1q immunostaining of hippocampal tissue slices of adult Disc1WT/WT Cx3cr1eGFP/+ and Disc1LI/LI Cx3cr1eGFP/+ mice. Scale bar, 10 μm. (H) FC quantification of C1q MFI in eGFP-positive microglia in situ. Shapiro-Wilk test followed by an unpaired two-tailed t test. *P < 0.05, **P < 0.01, ***P < 0.001, and ****P < 0.0001.
Fig. 4.
Fig. 4.. Cytoskeletal dysregulation caused by DISC1 deficiency alters microglial morphology, surveillance, and phagocytosis.
(A) Representative three-dimensional (3D) renders and skeletonized in situ Disc1WT/WT Cx3cr1eGFP/+ and Disc1LI/LI Cx3cr1eGFP/+ postnatal day 21 (P21) microglia. Scale bar, 10 μm. (B) Total branch length (P < 0.0001), and (C) the number of Sholl analysis process intersections (P < 0.001) of in situ Disc1WT/WT (456 cells from six animals) and Disc1LI/LI (447 cells from six animals) microglia. (D) Representative two-photon microscopy images of P21 Disc1WT/WT Cx3cr1eGFP/+ and Disc1LI/LI Cx3cr1eGFP/+ microglia. Images taken 1 min apart are overlaid with different colors. Scale bar, 10 μm. (E) Motility index of Disc1WT/WT Cx3cr1eGFP/+ (n = 105) and Disc1LI/LI Cx3cr1eGFP/+ (n = 86) microglia in acute brain slices. (F) The speed of extension (Ext) (P = 0.0215; n ≥ 104 per genotype) and retraction (Retr) (P = 0.0203; n ≥ 141 per genotype) events was quantified from at least five independent slices per mouse. (G) Representative images of postsynaptic density 95 (PSD95; red) immunoreactive puncta in dorsal cornu ammonis 1 (CA1) P21 microglia. Circles indicate overlap. Scale bar, 5 μm. (H) Quantitative analysis of (G) indicates increased uptake of synaptic material by Disc1LI/LI microglia (P = 0.0074) (n = 300 cells from five mice). (I) Flow cytometry–based 1,1′-dioctadecyl-3,3,3′,3′- tetramethylindocarbocyanine perchlorate (DiI)–labeled synaptosome uptake in primary microglia measured by the MFI of phagocytic cells. (J) The percentage of phagocytic microglia. n = 3; repeated-measures (RM) two-way ANOVA with multiple comparisons. Data are represented as mean ± SD. [(B), (E), (F), and (H)] Data points represent individual microglia. Horizontal bars indicate the median. Shapiro-Wilk test followed by the two-tailed Mann-Whitney U test. (C) Filled data points indicate significant differences (P < 0.001; multiple two-tailed Mann-Whitney U tests) from the equidistant value in WT. Data are represented as mean ± SEM. *P < 0.05, **P < 0.01, ***P < 0.001, and ****P < 0.0001.
Fig. 5.
Fig. 5.. WT microglia-like cells rescue cognitive and synaptic deficits through decreased synaptic elimination in the Disc1LI/LI hippocampus.
(A) Experimental setup. Ephys, electrophysiology. (B) Representative brain section 13 weeks post-BMT shows that most IBA1-positive microglia-like cells are donor-derived (eGFP+). Scale bar, 150 μm. One-way ANOVA with Tukey’s test. (C) In the object location test (OLT), LI → LI mice showed a significantly lower discrimination index than WT → WT (P = 0.0069) and WT → LI (P = 0.0231). (D) No significant differences were observed in the object recognition test (ORT). #, significantly different from zero, one-sample t test. (E) Latency to fall from the rotarod is dependent on recipient genotype (two-way RM ANOVA with Šidák’s test). (F) Representative recordings of mEPSCs with an enlarged view of a single synaptic event. (G) Cumulative probabilities (Cum. Prob.) of the mEPSC frequencies are plotted. Inset: The corresponding quantitative values of the frequency of mEPSCs per cell. LI → LI versus WT → WT (Cum. Prob. P = 0.0001; inset P = 0.0027) and versus WT → LI (Cum. Prob. P = 0.0048; inset P = 0.0440; n = 4 to 11 cells). (H) Cumulative probabilities and quantification (in inset) of the amplitude of mEPSCs show a significant reduction in the LI → LI mice compared to WT → WT mice (Cum. Prob. P > 0.9999; inset P = 0.0062) but no significant differences among other groups (n = 4 to 11 cells). (I and J) Vesicular glutamate transporter (vGLUT)1/PSD95 staining in the dorsal hippocampal CA1 region reveals fewer synaptic colocalizations (white circles) in LI → LI (P = 0.0223) and LI → WT (P = 0.0224) versus WT → WT. Scale bar, 5 μm. (K and L) Representative images of PSD95+ puncta engulfed by dorsal CA1 eGFP+ microglia. Scale bar, 5 μm. Quantification shows increased engulfment by LI → LI and LI → WT donor cells (n = 40 cells from five mice). [(C) and (D)] Kruskal-Wallis with Dunn’s test. [(G), (H), (J), and (L)] One-way ANOVA with Tukey’s test. *P < 0.05, **P < 0.01, and ***P < 0.001.

References

    1. Stiles J., Jernigan T. L., The basics of brain development. Neuropsychol. Rev. 20, 327–348 (2010). - PMC - PubMed
    1. Silbereis J. C., Pochareddy S., Zhu Y., Li M., Sestan N., The cellular and molecular landscapes of the developing human central nervous system. Neuron 89, 248–268 (2016). - PMC - PubMed
    1. Salter M. W., Stevens B., Microglia emerge as central players in brain disease. Nat. Med. 23, 1018–1027 (2017). - PubMed
    1. Squarzoni P., Thion M. S., Garel S., Neuronal and microglial regulators of cortical wiring: Usual and novel guideposts. Front. Neurosci. 9, 248 (2015). - PMC - PubMed
    1. Reisinger S., Khan D., Kong E., Berger A., Pollak A., Pollak D. D., The poly(I:C)-induced maternal immune activation model in preclinical neuropsychiatric drug discovery. Pharmacol. Ther. 149, 213–226 (2015). - PubMed

LinkOut - more resources