Clinical Trial
. 2025 Aug 29;11(35):eadw3934.
doi: 10.1126/sciadv.adw3934. Epub 2025 Aug 29.

Lubiprostone in chronic kidney disease: Insights into mitochondrial function and polyamines from a randomized phase 2 clinical trial

Affiliations
Clinical Trial

Lubiprostone in chronic kidney disease: Insights into mitochondrial function and polyamines from a randomized phase 2 clinical trial

Shun Watanabe et al. Sci Adv. .

Abstract

Chronic kidney disease (CKD) is a life-threatening condition, and constipation is a progressive risk factor. We evaluated changes in uremic toxins, renal function, and the safety of lubiprostone, a selective chloride channel activator, in patients with CKD. In this phase 2, randomized, double-blind, placebo-controlled trial across nine centers in Japan, 150 patients with stage IIIb-IV CKD received lubiprostone (8 or 16 micrograms) or placebo for 24 weeks. The primary end point was change in indoxyl sulfate levels. Secondary end points included other uremic toxins and renal function markers. Lubiprostone did not alter uremic toxin levels but improved or preserved estimated glomerular filtration rate and its slope in the 16-microgram group. Mild-to-moderate gastrointestinal events occurred in the placebo and 16-microgram groups. Multiomics analysis revealed that lubiprostone modulated the gut microbial agmatine pathway and increased spermidine levels, thereby improving renal mitochondrial function. Lubiprostone is a previously unknown and safe therapeutic option to mitigate renal decline in CKD.


Figures
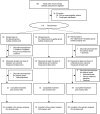
Fig. 1.
Fig. 1.. Clinical study flow diagram.
Of the 118 participants, 6 patients (4 from the lubiprostone 16-μg/day group and 2 from the placebo group) withdrew from the trial. One participant each from the lubiprostone 16-μg/day and the placebo groups was not included in the analysis of the primary end point because of their withdrawal before the first measurement of the indoxyl sulfate after the study drug administration. Clinical Trials registry number: UMIN000023850.
Fig. 2.
Fig. 2.. Time courses for changes in uremic toxins.
(A to D) Time course of change from baseline in levels of IS (A), PS (B), PCS (C), TMAO (D). Left, main analysis (all patients). Middle and right, subgroup analysis (CKD moderate group: eGFR, 36 to 45 ml/min per 1.73 m2; CKD severe group: eGFR, 25 to 35 ml/min per 1.73m2) groups. These were expressed as LSM ± 95% CI. P values were calculated for between-group comparisons as follows: an analysis of covariance (ANCOVA) model was applied at each measurement time point, followed by Dunnett’s post hoc test. No adjustment for multiple comparisons between time points was made. *P < 0.05, lubiprostone 16-μg/day group versus placebo group and †P < 0.05, lubiprostone 8-μg/day group versus placebo group. IS, indoxyl sulphate; PS, phenyl sulphate; PCS, p-cresyl sulphate; TMAO, trimethylamine N-oxide; LOCF, last observation carried forward.
Fig. 3.
Fig. 3.. Time courses for changes in renal functions.
(A, B, D, and F) Time course of change from baseline in levels of BUN (A), Cr (B), eGFRCr (D), and eGFRCys (F). (C, E, and G) The slope of 1/Cr (C), eGFRCr (E), and eGFRCys (G). [(A) to (G)] Left, main analysis (all patients). Middle and right, subgroup analysis (CKD moderate group: eGFR 36 to 45 ml/min per 1.73 m2; CKD severe group: eGFR 25 to 35 ml/min per 1.73 m2) groups. The slope of 1/Cr, eGFRCr, and eGFRCys were expressed as mean ± 95% CI, along with the linear regression line, while others were expressed as LSM ± 95% CI. P values were calculated for between-group comparisons as follows: For the slope of 1/Cr, eGFRCr and eGFRCys, a mixed-effects model was used; for the other end points, an ANCOVA model was applied at each measurement time point, followed by Dunnett’s post hoc test. No adjustment for multiple comparisons between time points was made. *P < 0.05, **P < 0.01, lubiprostone 16-μg/day group versus placebo group and †P < 0.05, ††P < 0.01, lubiprostone 8-μg/day group versus placebo group. BUN, blood urea nitrogen.
Fig. 4.
Fig. 4.. Multiomics analysis.
Analyses included only patients with both pre- and posttreatment fecal samples (placebo: 13; 14 μg: 8; 16 μg: 19). To focus on higher efficacy, placebo and lubiprostone 16-μg/day groups were further divided into responders (placebo: 7; 16 μg: 9) and nonresponders (placebo: 6; 16 μg: 10). (A and B) Heatmaps integrating metabolomics, 16S rRNA, and shotgun metagenomics (phylogenetic and functional) show items meeting criteria detailed in Methods. [(A) Three-group analysis; (B) Responder/nonresponder]. Colors represent group-averaged z scores. Items are ordered by ascending P values; those increased are shown first. For functional analysis, the top 12 (A) or 13 (B) increased items are shown. Key KO, aguA, is bolded. (C) Bar plots show taxa with substantial changes (ALDEx2), ordered by descending effect size. Symbols beside box plots indicate presence of aguA in KEGG-registered strains within each genus: “+” (present), “−” (only absent), “?” (no data). (D) Relative abundance of aguA from shotgun metagenomics (Left, three-group; right, responder analysis). Lines connect the same participants. Wilcoxon signed-rank test was used. (E) Diagram of polyamine biosynthesis pathway involving aguA. (F) Box plots of plasma polyamines (PUT, SPD, and SPM) before versus after treatment. Changes from baseline were compared using ANCOVA, as for the primary end point. *P < 0.05, **P < 0.01. speA, arginine decarboxylase; speB, agmatinase; speC, ornithine decarboxylase; speE, spermidine synthase; aguA, agmatine deiminase; aguB, N-carbamoylputrescine amidase; rocF, arg, arginase; SMS, spermine synthase; PUT, putrescine; SPD, spermidine; SPM, spermine.
Fig. 5.
Fig. 5.. Oral administration of polyamines to adenine-induced RF mice also showed improvement in RF.
(A) Protocol diagram. SPD (3 mM) was administered via drinking water. (B) Plasma Cr. (C) H&E and MT staining of renal cortex. Tubular area was quantified in the entire cortex stained with MT. Scale bar, 100 μm. (D) Plasma GDF15 concentration. (E) SoRa imaging of COX IV–stained mitochondria. Representative maximum intensity projections and quantification of mitochondrial volume, network, intermediate, and fragmented features. Scale bar, 5 μm. (F to H) RNA-seq analysis of renal tissue. (F) Principal components analysis (PCA) comparing the three groups: Control, RF, and SPD. (G) Venn diagram, heatmap, and enrichment analysis of genes up-regulated in RF and down-regulated by SPD. (H) Venn diagram and enrichment analysis of genes down-regulated in RF and restored by SPD. A heatmap highlights mitochondrial genes within this set. Statistical tests: one-way analysis of variance (ANOVA) with Tukey test for (B) and (D); Kruskal-Wallis with Dunn test for (E). *P < 0.05, **P < 0.01, ***P < 0.001, ****P < 0.0001. [(A) to (E)] Control (Ctrl), n = 6; RF, n = 6; RF + SPD, n = 7. [(F) to (H)] Control (Ctrl), n = 6; RF, n = 5; RF + SPD, n = 5. H&E, hematoxylin and eosin; MT, Masson-Trichrome; RF, renal failure; SPD, spermidine; COX, cytochrome c oxidase; Ctrl, control; Lubi, lubiprostone.
Fig. 6.
Fig. 6.. Polyamine-mediated renal protection via the lubiprostone-gut-kidney axis.
This is a schematic model showing the improvement in renal function caused by the administration of lubiprostone. The administration of lubiprostone alters the microbiota, and agmatine deiminase (aguA) increases. The polyamine concentration in the host blood increases, and this has a protective effect on the mitochondria and suppresses inflammation in the kidneys, preventing the progression of RF. Created in BioRender. Abe, T. (2025) https://BioRender.com/51t2iwg.

References

    1. Levin A., Tonelli M., Bonventre J., Coresh J., Donner J. A., Fogo A. B., Fox C. S., Gansevoort R. T., Heerspink H. J. L., Jardine M., Kasiske B., Kottgen A., Kretzler M., Levey A. S., Luyckx V. A., Mehta R., Moe O., Obrador G., Pannu N., Parikh C. R., Perkovic V., Pollock C., Stenvinkel P., Tuttle K. R., Wheeler D. C., Eckardt K. U., ISN Global Kidney Health Summit participants , Global kidney health 2017 and beyond: A roadmap for closing gaps in care, research, and policy. Lancet 390, 1888–1917 (2017). - PubMed
    1. Vanholder R., Annemans L., Braks M., Brown E. A., Pais P., Purnell T. S., Sawhney S., Scholes-Robertson N., Stengel B., Tannor E. K., Tesar V., van der Tol A., Luyckx V. A., Inequities in kidney health and kidney care. Nat. Rev. Nephrol. 19, 694–708 (2023). - PubMed
    1. Taguma Y., Kitamoto Y., Futaki G., Ueda H., Monma H., Ishizaki M., Takahashi H., Sekino H., Sasaki Y., Effect of captopril on heavy proteinuria in azotemic diabetics. N. Engl. J. Med. 313, 1617–1620 (1985). - PubMed
    1. Lewis E. J., Hunsicker L. G., Bain R. P., Rohde R. D., The effect of angiotensin-converting-enzyme inhibition on diabetic nephropathy. The Collaborative Study Group. N. Engl. J. Med. 329, 1456–1462 (1993). - PubMed
    1. Brenner B. M., Cooper M. E., de Zeeuw D., Keane W. F., Mitch W. E., Parving H. H., Remuzzi G., Snapinn S. M., Zhang Z., Shahinfar S., Investigators R. S., Effects of losartan on renal and cardiovascular outcomes in patients with type 2 diabetes and nephropathy. N. Engl. J. Med. 345, 861–869 (2001). - PubMed

Publication types

LinkOut - more resources