. 2025 Aug 29;11(35):eads7381.
doi: 10.1126/sciadv.ads7381. Epub 2025 Aug 29.

Abnormal mitochondrial structure and function in brown adipose tissue of SLC35A4-MP knockout mice

Affiliations

Abnormal mitochondrial structure and function in brown adipose tissue of SLC35A4-MP knockout mice

Andréa L Rocha et al. Sci Adv. .

Abstract

Uncovering the role of upstream open reading frames (uORFs) challenges conventional views of one protein per messenger RNA and reveals the capacity of some uORFs to encode microproteins that contribute to cellular biology and physiology. This study explores the functional role of a recently identified mitochondrial microprotein, SLC35A4-MP, in the brown adipose tissue of mice. Our findings reveal dynamic regulation of SLC35A4-MP expression during primary brown adipocyte differentiation in vitro and during cold exposure or high-fat diet (HFD)-induced obesity in mice. Using a knockout mouse model, we show that loss of SLC35A4-MP disrupts mitochondrial lipid composition, decreasing cardiolipins and phosphatidylethanolamine in brown adipose tissue from HFD-fed mice. SLC35A4-MP deficiency also impairs mitochondrial activity, alters mitochondrial number and morphology, and promotes inflammation. Knockout mice accumulate acylcarnitines during cold exposure, indicating defective fatty acid oxidation. These findings reveal SLC35A4-MP as a previously unrecognized microprotein in regulating mitochondrial function and tissue lipid metabolism, adding to the growing list of functional endogenous microproteins.


Figures

Fig. 1.
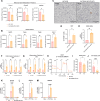
Fig. 1.. SLC35A4-MP expression across tissues and its up-regulation in BAT by HFD.
(A) Representative SLC35A4-MP blot in various tissues, including brain, kidney, lung, spleen, testis, BAT, eWAT, skeletal muscle (gastrocnemius), heart, and liver from male C57BL6 wild-type mice. Ponceau staining served as a protein level control. (B) HFD and chow diet feeding schematic and protocol for BAT collection were created in BioRender. Saghatelian, A. (2025) https://BioRender.com/9luycjt. (C) Representative SLC35A4-MP blot and (D) quantification in BAT of HFD-fed C57BL/6 male mice (n = 4 per group). (E) qPCR analysis of Slc35a4 mRNA expression in BAT of HFD-fed C57BL/6 male mice (n = 4 to 6 per group). Data presented as means ± SEM, with * indicating statistical significance (P < 0.05, unpaired t test) compared to the chow diet.
Fig. 2.
Fig. 2.. Impact of HFD-induced obesity on SLC35A4-MP expression in BAT.
Effects of 12-Week HFD in female SLC35A4-MP KO (KO) and WT mice. (A) Initial and 12-week body weight under HFD feeding (two-way ANOVA followed by Šídák’s multiple comparisons test). (B) Fat tissue weight; (C) fasting blood glucose levels; (D) glucose tolerance test (GTT), also expressed as (E) the area under the curve (AUC); (F) BAT histology: hematoxylin and eosin stain in BAT. Scale bar, 100 μm. (G) Quantification of lipid droplet (LD) size in micrometer. (H to J) LC-MS/MS–based untargeted lipidomics of BAT from SLC35A4-MP KO mice and their controls after 12 weeks of HFD feeding (n = 5 per group). (I) The total sum of triacylglycerol species detected in BAT. (J) Heatmap showing the total sum levels of phosphatidic acid (PA, P < 0.001), acylcarnitines (AcCa), phosphatidylinositol (PI), phosphatidylserine (PS), lysophosphatidylcholine (LPC), phosphatidylglycerol (PG), phosphatidylcholine (PC), lysophosphatidylethanolamine (LPE), lysophosphatidylglycerol (LPG, P < 0.02), phosphatidylethanolamine (PE, P < 0.007), and cardiolipin (CL, P < 0.007). Data presented as means ± SEM, with * indicating statistical significance (*P < 0.05, ****P < 0.0001, unpaired t test) compared to the WT mice. ns, not significant.
Fig. 3.
Fig. 3.. Impact of SLC35A4-MP deletion on mitochondrial size, shape, and dynamics in BAT.
Twelve-week HFD or chow diet in male SLC35A4-MP KO and WT mice. (A) Mitochondrial tomography slices: 1.6-nm thickness slices from the center of EM tomography volumes of BAT mitochondria from BAT of male WT mice (left) and SLC35A4-MP KO (right) mice with increased mitochondrial area and decreased numbers (scale bar, 1 μm). (B) Quantification of the mitochondrial profile area (size) (n = 14 to 54 per group), (C) number of mitochondria per unit area of cytoplasm (#mitochondria per square micrometer) (n = 10 per group), (D) mitochondrial shape (ratio major and minor axis) (n = 14 to 54 per group), and (E) cristae density (n = 10 mito per group). Data presented as means ± SEM, with * indicating statistical significance [*P < 0.05, **P < 0.01, ***P < 0.001, ****P < 0.0001, two-way analysis of variance (ANOVA)] compared to the WT mice.
Fig. 4.
Fig. 4.. Proteomic and functional changes reveal mitochondrial dysfunction and inflammation in BAT of SLC35A4-MP KO mice.
(A to D) TMT-labeled proteomics analysis of BAT from male SLC35A4-MP KO mice fed an HFD for 12 weeks (n = 4 per group). Proteomic samples were processed using a standard TMT workflow, resulting in high proteome coverage with more than 2000 proteins detected. (A) Levels of mitochondrial metabolic protein Perm1, Chchd7, and Ndufs8 (n = 4 per group) and (B) relative abundance of inflammation-related proteins in BAT, including galectin-3 (Lgals3), macrophage-capping protein (Capg), tapasin (Tapbp), and intercellular adhesion molecule 1 (Icam1). (C) Representative F4/80 immunohistochemistry images with eosin counterstaining (40× magnification). (D) Quantification of F4/80+ staining area using ImageJ (% area; n = 5 per group). (E) qPCR analysis of Cd86 gene expression and (F) proinflammatory cytokines in BAT of male and (G) female mice (n = 5 per group). (H to J) Respiratory ratio analysis in BMDMs activated with IL-4 from male SLC35A4-MP KO and WT mice fed with chow diet. (I) Basal respiratory capacity (J) ATP-linked respiratory capacity using Seahorse XF96 (n = 12 per group). (K to M) Gene expression of proinflammatory cytokines in BMDMs activated with IFN-γ + LPS or IL-4, (K) Tnf-a mRNA, (L) Il1b mRNA, (M) Il12b mRNA (two-way ANOVA followed by Šídák’s multiple comparisons test, n = 3 per group). Data presented as means ± SEM, with * indicating statistical significance (*P < 0.05, **P < 0.01, ****P < 0.0001 unpaired t test for all other panels) compared to the WT mice.
Fig. 5.
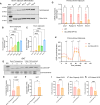
Fig. 5.. SLC35A4-MP and brown adipocyte function.
(A) Representative SLC35A4-MP blot and (B) quantification of SLC35A4-MP levels in immortalized murine interscapular brown preadipocytes during differentiation of mature brown adipocytes by Western blot (n = 3 per group). (C) qPCR analysis of Slc35a4 mRNA expression. (D) Representative Western blot and (E) quantification of SLC35A4-MP levels in BAT from 12-week-old male WT mice after 3 days of cold exposure (chronic cold exposure) (n = 3 per group). (F) qPCR evaluation of Slc35a4 mRNA expression in BAT following chronic cold exposure (n = 3 to 4 per group). (G) qPCR analysis of brown adipocyte markers, Ucp1, Ppargc1a, Prdm16, and Elovl3 mRNA in primary brown adipocytes differentiated from the stroma vascular fraction of BAT derived from 1-month-old male SLC35A4-MP KO and WT mice (n = 3 per group). (H) OCR profile of primary brown adipocytes from SLC35A4-MP KO and WT mice. (I) Quantification of basal, (J) maximal, and (K) ATP-linked respiration (n = 10 per group). Data presented as means ± SEM, with * indicating statistical significance (*P < 0.05, **P < 0.01, ****P < 0.0001, unpaired t test) compared to the WT.
Fig. 6.
Fig. 6.. The impact of SLC35A4-MP KO in BAT during cold stress.
Effects of acute and chronic cold exposure on 12-week-old male SLC35A4-MP KO and WT mice fed a chow diet. (A and B) Rectal body temperature during cold exposure (n = 6 per group). (C) LC-MS/MS–based untargeted lipidomics of BAT from SLC35A4-MP KO mice and their controls after 3 days of cold exposure (n = 3 per group). (D) Acylcarnitine levels in BAT (two-way ANOVA followed by Šídák’s multiple comparisons test, n = 3 per group). (E) Mitochondrial tomography slices: 1.6-nm thickness slices from the center of EM tomography volumes of BAT mitochondria from BAT of WT mice (left) and SLC35A4-MP KO (right) male mice after chronic cold challenge (scale bar, 1 μm). RT, room temperature. (F) Quantification of the mitochondria profile area (size in square micrometer) (n = 21 to 54 per group), (G) number of mitochondria per unit area of cytoplasm (#mitochondria per square micrometer) (n = 10 per group), and (H) mitochondrial shape (ratio major and minor axis) (n = 21 to 54 per group). Data presented as means ± SEM, with * indicating statistical significance (*P < 0.05, **P < 0.01, ****P < 0.0001, unpaired t test for all other panels) compared to the WT mice.
Fig. 7.
Fig. 7.. Proposed model of SLC35A4-MP function in BAT.
A schematic model illustrating how SLC35A4-MP supports mitochondrial structure and lipid metabolism in BAT. Loss of SLC35A4-MP leads to altered mitochondrial morphology, reduced oxidative capacity, acylcarnitine accumulation, and inflammation, ultimately impairing thermogenic function. Created in BioRender. Saghatelian, A. (2025) https://BioRender.com/38j8mtz.

References

    1. Basrai M. A., Hieter P., Boeke J. D., Small open reading frames: Beautiful needles in the haystack. Genome Res. 7, 768–771 (1997). - PubMed
    1. Lawrence J., When ELFs are ORFs, but don’t act like them. Trends Genet. 19, 131–132 (2003). - PubMed
    1. Mouilleron H., Delcourt V., Roucou X., Death of a dogma: Eukaryotic mRNAs can code for more than one protein. Nucleic Acids Res. 44, 14–23 (2016). - PMC - PubMed
    1. Sendoel A., Dunn J. G., Rodriguez E. H., Naik S., Gomez N. C., Hurwitz B., Levorse J., Dill B. D., Schramek D., Molina H., Weissman J. S., Fuchs E., Translation from unconventional 5′ start sites drives tumour initiation. Nature 541, 494–499 (2017). - PMC - PubMed
    1. Dumesic P. A., Egan D. F., Gut P., Tran M. T., Parisi A., Chatterjee N., Jedrychowski M., Paschini M., Kazak L., Wilensky S. E., Dou F., Bogoslavski D., Cartier J. A., Perrimon N., Kajimura S., Parikh S. M., Spiegelman B. M., An evolutionarily conserved uORF regulates PGC1α and oxidative metabolism in mice, flies, and bluefin tuna. Cell Metab. 30, 190–200.e6 (2019). - PMC - PubMed

MeSH terms

LinkOut - more resources