Prevalence of excess binaural broadband loudness summation in the hearing-impaired population and implications for hearing aid gain targets
- PMID: 40880500
- PMCID: PMC12396666
- DOI: 10.1371/journal.pone.0330517
Prevalence of excess binaural broadband loudness summation in the hearing-impaired population and implications for hearing aid gain targets
Abstract
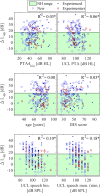
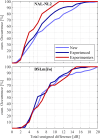
Previous studies reported large individual differences in binaural broadband loudness summation in hearing-impaired listeners after narrowband loudness was normalized. These differences in loudness perception might require substantial fine-tuning for some hearing aid users to provide acceptable loudness in daily use. The present study aims at characterizing binaural broadband loudness summation for a hearing-impaired population, the prevalence of higher-than-normal values, and the potential implications for hearing aid target gains. For 180 hearing-impaired participants we measured standard audiological diagnostic parameters, binaural broadband loudness summation and computed gain targets according to NAL-NL2, DSLm[i/o] and trueLOUDNESS, a prescriptive procedure that includes individual loudness measurements. The observed binaural broadband loudness summation of the hearing-impaired participants was, on average, 13 dB higher and showed a higher variance relative to a normal-hearing reference group. In about 40% of all participants a binaural broadband loudness summation was beyond the normal-hearing range. The average excess loudness summation appears to be included in established prescriptive procedures, while relevant differences to trueLOUDNESS gain targets were observed in more than half of the participants. Elevated binaural broadband loudness summation appears to be a prevalent and individual trait in the hearing-impaired population and its assessment might be useful for individualized hearing aid fitting.
Copyright: © 2025 Denk et al. This is an open access article distributed under the terms of the Creative Commons Attribution License, which permits unrestricted use, distribution, and reproduction in any medium, provided the original author and source are credited.
Conflict of interest statement
Florian Denk and Hendrik Husstedt have no conflicts of interest to declare. Dirk Oetting is an employee of Hoerzentrum Oldenburg, which owns the rights on the trueLOUDNESS procedure. Matthias Latzel is an employee of Sonova AG, which funded this study. Harald Bonsel co-owns Acousticon GmbH, which commercially offers the trueLOUDNESS procedure on the ACAM5 audiometer. Employment by commercial companies did not affect the authors’ decisions regarding experimental design, data collection and analysis, decision to publish, or the adherence to PLOS ONE policies on sharing data and materials.
Figures


Similar articles
-
Restoring Perceived Loudness for Listeners With Hearing Loss.Ear Hear. 2018 Jul/Aug;39(4):664-678. doi: 10.1097/AUD.0000000000000521. Ear Hear. 2018. PMID: 29210810
-
Spectral and binaural loudness summation for hearing-impaired listeners.Hear Res. 2016 May;335:179-192. doi: 10.1016/j.heares.2016.03.010. Epub 2016 Mar 19. Hear Res. 2016. PMID: 27006003
-
Bilateral versus unilateral hearing aids for bilateral hearing impairment in adults.Cochrane Database Syst Rev. 2017 Dec 19;12(12):CD012665. doi: 10.1002/14651858.CD012665.pub2. Cochrane Database Syst Rev. 2017. PMID: 29256573 Free PMC article.
-
Interventions to improve hearing aid use in adult auditory rehabilitation.Cochrane Database Syst Rev. 2014 Jul 12;(7):CD010342. doi: 10.1002/14651858.CD010342.pub2. Cochrane Database Syst Rev. 2014. Update in: Cochrane Database Syst Rev. 2016 Aug 18;(8):CD010342. doi: 10.1002/14651858.CD010342.pub3. PMID: 25019297 Updated.
-
Interventions to improve hearing aid use in adult auditory rehabilitation.Cochrane Database Syst Rev. 2016 Aug 18;2016(8):CD010342. doi: 10.1002/14651858.CD010342.pub3. Cochrane Database Syst Rev. 2016. PMID: 27537242 Free PMC article.
References
-
- Dillon H. Hearing aids. 2 ed. Turramurra: Boomerang Press. 2012.
MeSH terms
LinkOut - more resources
Full Text Sources
Medical
Miscellaneous

