. 2025 Sep 2;122(35):e2513155122.
doi: 10.1073/pnas.2513155122. Epub 2025 Aug 29.

Activation of WNK1 signaling through Piezo1

Affiliations

Activation of WNK1 signaling through Piezo1

Ji-Ung Jung et al. Proc Natl Acad Sci U S A. .

Abstract

With No lysine (K) 1 (WNK1) is essential for ion and volume homeostasis, sensing osmotic stress and activating pathways that regulate ion transport. Its response to osmotic stress shares similarities with the function of the mechanosensitive ion channel Piezo1. In this study, we show that Yoda1, a Piezo1 agonist, activates WNK1 downstream kinase targets oxidative stress-responsive 1 (OSR1) and STE20/SPS1-related serine, proline-, and alanine-rich kinase (SPAK) in endothelial cells within minutes. Ionophore-induced Ca2+ influx similarly triggers their activation. Comparable responses were observed in HDMEC, HUVEC, A549, MDA-MB-231, and HeLa cells. Hypotonic stress also enhances SPAK and OSR1 phosphorylation, which is attenuated by WNK1 inhibition or Piezo1 knockdown, whereas hypertonic stress-induced phosphorylation is not affected by Piezo1 knockdown. Chelating Ca2+ or depleting intracellular stores prevents their activation, while increasing intracellular Ca2+ via the Na+/Ca2+ exchanger or thapsigargin enhances it. ER-released Ca2+ is sufficient to activate SPAK and OSR1 even in the absence of extracellular Ca2+, and this effect is diminished by Piezo1 knockdown. Both Yoda1 and ionomycin promote phosphorylation of WNK1 at serine 382, a modification that increases its catalytic activity. These findings identify Piezo1 as an activator of WNK1, linking Ca2+ dynamics to WNK1-OSR1/SPAK signaling.

Keywords: OSR1; Piezo1; SPAK; WNK1; osmotic stress.


Conflict of interest statement

Competing interests statement:The authors declare no competing interest.

Figures
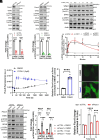
Fig. 1.
Fig. 1.
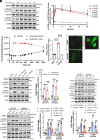
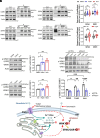
Piezo1 agonist Yoda1 activates WNK1-OSR1/SPAK signaling. (A) Immunoblot analysis of HDMECs treated with siCTRL (negative control) or siPiezo1 for 72 h. Equal amounts of cell lysates were subjected to SDS-PAGE and immunoblotted with indicated antibodies. Data are representative for three independent experiments (mean ± SD), ***P < 0.001, ****P < 0.0001, unpaired two-tailed t test. (B) Immunoblot analysis of HDMECs treated with DMSO or WNK463 (1 μM) for 5 min. Data are presented as mean ± SD. ***P < 0.001, ****P < 0.0001 (unpaired two-tailed t test, n = 3). (C) HDMECs were treated with Yoda1 (5 µM) for the indicated time points and analyzed by immunoblotting using the specified antibodies. Graphs depict the relative levels of phosphorylated SPAK or OSR1. Data are presented as mean ± SEM. Statistical significance is indicated as follows: n, not significant; b, P < 0.01; c, P < 0.001; d, P < 0.0001, compared with 0 min, determined by one-way ANOVA with Tukey’s multiple comparison test (n = 3). (DF) HDMECs were loaded with Fluo-8 AM (2 µM) for 40 min at 37 °C. After recording 30 s baseline, cells were treated with DMSO or Yoda1 (5 μM) indicated by arrows. (D) Changes in intracellular Ca2+ levels were measured at the specified time points. Data are presented as mean ± SD (8 replicates, 2 independent experiments). (E) The relative intensity of Fluo-8 AM measured 5 min after treatment. Data are presented as mean ± SD. ****P < 0.0001, unpaired two-tailed t test (n = 3). (F) Representative Fluo-8 AM Ca2+ imaging (green) of HDMECs at 5 min. (Scale bar, 10 μm.) (G) Immunoblot analysis was performed on HDMECs treated with siCTRL or siPiezo1, followed by 5 min’ treatments with DMSO or Yoda1 (5 μM), using the indicated antibodies. Statistical significance was determined by two-way ANOVA with Tukey’s multiple comparison test (mean ± SD), **P < 0.01, ****P < 0.0001 (n = 3, siCTRL vs. siPiezo1). (H) Intracellular Ca2+ levels were measured in Fluo-8 AM (2 µM)-labeled siCTRL- or siPiezo1-HDMECs treated with Yoda1 (5 μM). Data are representative of three independent experiments (mean ± SD) ***P < 0.001, ****P < 0.0001, unpaired two-tailed t test (4 replicates).
Fig. 2.
Fig. 2.
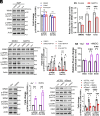
Ca2+ influx activates SPAK and OSR1. (A) HDMECs were incubated with ionomycin (2 µM) for the indicated time points and subjected to immunoblotting with the specified antibodies. Graphs show the relative levels of phosphorylated SPAK or OSR1. Data are presented as mean ± SEM. Statistical significance is indicated as follows: n, not significant; a, P < 0.05; b, P < 0.01; c, P < 0.001; d, P < 0.0001, compared with 0 min, determined by one-way ANOVA with Tukey’s multiple comparison test (n = 3). (BD) HDMECs were loaded with Fluo-8 AM (2 µM) for 40 min at 37 °C. After 30 s baseline was recorded, DMSO, ionomycin (2 μM), or WNK463 (1 μM) were added, as indicated by arrows. (B) Changes in intracellular Ca2+ levels were measured at the specified time points. Data are presented as mean ± SD (8 replicates, 2 independent experiments). (C) showed the relative intensity of Fluo-8 AM measured 5 min after treatment with DMSO and ionomycin (2 μM). Data are presented as mean ± SD, ****P < 0.0001 (unpaired two-tailed t test, n = 3). (D) Representative Fluo-8 AM Ca2+ imaging (green) of HDMECs at 5 min. (Scale bar, 10 μm.) (E) Immunoblot analysis of HDMECs treated with DMSO, Yoda1 (5 μM), or ionomycin (2 μM) in the presence or absence of WNK463 (1 μM) for 5 min. Data are presented as mean ± SD from three independent experiments. **P < 0.01, ***P < 0.001, ****P < 0.0001 (unpaired two-tailed t test, nontreated vs. WNK463-treated). (F) Immunoblot analysis of HDMECs treated with siCTRL or siWNK1, followed by treatment with DMSO, Yoda1 (5 μM), or ionomycin (2 μM) for 5 min. Data are presented as mean ± SD, **P < 0.01, ***P < 0.001 (unpaired two-tailed t test, n = 3, nontreated vs. WNK463-treated). (G) Immunoblot analysis was performed on HDMECs treated with siCTRL or siPiezo1, followed by 5 min’ treatments with DMSO, Yoda1 (5 μM), or Ionomycin (2 μM), using the indicated antibodies. Statistical significance was determined by the unpaired two-tailed t test (mean ± SD), *P < 0.05, **P < 0.01, ***P < 0.001 (n = 3, siCTRL vs. siPiezo1).
Fig. 3.
Fig. 3.
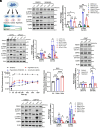
Intracellular Ca2+ drives WNK1 signaling activation through Piezo1. (A) HDMECs were preincubated in HBSS without Ca2+/Mg2+ (−Ca2+) containing 0.1% FBS for 1 h to induce Ca2+ starvation. After washing, the cells were treated with DMSO, Yoda1 (5 μM), or ionomycin (2 μM) in the Ca2+-free HBSS for 5 min. Equal amounts of cell lysates were subjected to SDS-PAGE and immunoblotted with indicated antibodies. The data are presented as means ± SD, ns, not significant (n = 3). (B) Fluo-8 AM (2 µM)-labeled HDMECs were preincubated with DMSO or BAPTA-AM (10 μM) for 10 min. Intracellular Ca2+ levels were then measured following treatment with DMSO, Yoda1 (5 μM), or ionomycin (2 μM) for 5 min. Data shown are mean ± SD. ***P < 0.001, unpaired two-tailed t test (8 replicates; n = 3). (C) Immunoblot analysis of HDMECs preincubated with DMSO or BAPTA-AM (10 μM) for 10 min, followed by treatment with DMSO, Yoda1 (5 μM), or ionomycin (2 μM) for 5 min. The results are expressed as mean ± SD. *P < 0.05, **P < 0.01, ***P < 0.001 (n = 3), unpaired two-tailed t test (DMSO-treated vs. BAPTA AM-treated). (D and E) Fluo-8 AM (2 µM)-labeled HDMECs were preincubated in a HEPES-buffered solution for 10 min, then washed and exposed to Na+-containing or NMDG-substituted (Na+-free) HEPES-buffered solutions for 5 min. (D) Intracellular Ca2+ levels were measured at the indicated time points. Data are presented as mean ± SD (8 replicates). ***P < 0.001, unpaired two-tailed t test (HEPES with Na+ vs. HEPES with NMDG). (E) The cell lysates were immunoblotted with the indicated antibodies. Data are representative of three independent experiments (mean ± SD) **P < 0.01, unpaired two-tailed t test. (F) Immunoblot analysis of siCTRL- or siPiezo1-treated HDMECs after 5 min incubation in either Na+-containing or NMDG-substituted (Na+-free) HEPES-buffered solutions. Data are presented as mean ± SD from three independent experiments. ***P < 0.001, ****P < 0.0001, analyzed by two-way ANOVA with Tukey’s multiple comparison test.
Fig. 4.
Fig. 4.
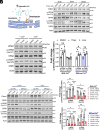
Hypoosmotic stress activates OSR1 and SPAK through Piezo1. (A) Schematic of a cell responding to osmotic stress, either hyperosmotic or hypoosmotic, resulting in changes in membrane tension and Ca2+ influx. (B) Immunoblot analysis of HDMECs treated with osmotic stress in the presence of DMSO or WNK463 (1 μM) for 5 min. The bar graph is presented as mean ± SD from three independent experiments. **P < 0.01, ***P < 0.001 (unpaired two-tailed t test, nontreated vs. WNK463-treated); #P < 0.05, ##P < 0.01, ###P < 0.001, ####P < 0.0001 (one-way ANOVA with Tukey’s multiple comparison test within the DMSO group). (C) siCTRL- and siPiezo1-treated HDMECs were exposed to osmotic stress for 5 min and analyzed by immunoblotting using the indicated antibodies. The results are expressed as mean ± SD. ns, not significant; *P < 0.05, **P < 0.01, ***P < 0.001 (n = 3), unpaired two-tailed t test (siCTRL vs. siPiezo1). (D and E) Intracellular Ca2+ levels were measured in Fluo-8 AM (2 µM)-labeled HDMECs exposed to isotonic, hypertonic (500 mM NaCl), or hypotonic [3:2 (v/v) deionized H2O/culture medium mixture] solutions, as indicated by the arrows. Data are expressed as mean ± SD (8 replicates, 2 independent experiments) (D). The graph represents the relative Fluo-8 AM intensity measured 3 min after osmotic stress exposure (E). Data are shown as mean ± SD. ***P < 0.001 (unpaired two-tailed t test, 8 replicates). (F) Ca2+-starved HDMECs, maintained in Ca2+/Mg2+-free HBSS (−Ca2+) containing 0.1% FBS for 1 h, were exposed to osmotic stress in the Ca2+-free HBSS for 5 min. Cell lysates were analyzed by SDS-PAGE and immunoblotting. Data are shown as mean ± SD. **P < 0.01; ns, not significant (n = 3). (G) Immunoblot analysis of HDMECs preincubated with DMSO or BAPTA-AM (10 μM) for 10 min, followed by exposure to osmotic stress for 5 min. The results are presented as mean ± SD. ns, not significant; *P < 0.05, **P < 0.01, ***P < 0.001 (n = 3), unpaired two-tailed t test (DMSO-treated vs. BAPTA-AM-treated).
Fig. 5.
Fig. 5.
The release of Ca2+ from intracellular stores is sufficient to activate WNK1 signaling. (A) Thapsigargin and ionomycin increase cytosolic Ca2+ through different mechanisms: Thapsigargin inhibits Ca2+ reuptake into the ER, while ionomycin facilitates Ca2+ release from the ER. (B) HDMECs treated with DMSO or thapsigargin (5 µM, 15 µM) for 3, 5, and 10 min were analyzed by immunoblotting using the indicated antibodies. (C) HDMECs were treated with DMSO, thapsigargin (10 µM), or ionomycin (2 µM) for 5 min in HBSS with Ca2+/Mg2+ (+Ca2+) or HBSS without Ca2+/Mg2+ (−Ca2+). Cell lysates were then subjected to SDS-PAGE and immunoblotted with the indicated antibodies. Data are presented as mean ± SD. *P < 0.05, **P < 0.01, analyzed by one-way ANOVA with Tukey’s multiple comparison test (n = 3). (D) Immunoblot analysis of siCTRL- and siPiezo1-HDMECs treated with DMSO, thapsigargin (10 µM), or ionomycin (2 µM) for 5 min in HBSS with Ca2+/Mg2+ (+Ca2+) or HBSS without Ca2+/Mg2+ (−Ca2+) was performed. Data are representative of three independent experiments (mean ± SD). *P < 0.05, **P < 0.01, ***P < 0.001, ****P < 0.0001, analyzed by two-way ANOVA with Tukey’s multiple comparison test.
Fig. 6.
Fig. 6.
Ca2+ modulates WNK1 signaling by increasing its kinase activity. (A and B) MDA-MB-231 cells were treated with DMSO, Yoda1 (5 μM), or ionomycin (2 μM) for 5 min (A) or exposed to osmotic stress for 5 min (B). Cell lysates were subjected to immunoprecipitation (IP) using Immunoglobulin G (IgG) or anti-OSR1 or anti-SPAK antibodies, followed by immunoblotting with the indicated antibodies. (C) Pearson’s coefficients for colocalization of WNK1 with OSR1 or SPAK from SI Appendix, Fig. S10 B and C are shown in immunofluorescence staining of HDMECs treated with DMSO, Yoda1 (5 μM), or ionomycin (2 μM) for 5 min (Upper), or exposed to isotonic and hypotonic conditions for 5 min (Lower). Data are represented as violin plots with all individual data points (n ≥ 10 cells per condition). ns, not significant; **P < 0.01, unpaired two-tailed t test. (D and E) Immunoblot analysis of phosphorylated WNK1 at S382 (p-WNK S382) in HDMECs treated with DMSO, Yoda1 (5 μM), or ionomycin (2 μM) for 3 min (D), or exposed to osmotic stress for 5 min (E). Data are presented as mean ± SD. *P < 0.05, **P < 0.01 (one-way ANOVA with Tukey’s multiple comparison test, n = 3). (F) p-WNK S382 was assessed by immunoblotting in siCTRL- and siPiezo1-HDMECs following 3 min treatment with DMSO, Yoda1 (5 μM), or ionomycin (2 μM). Data are presented as mean ± SD from three independent experiments. *P < 0.05, **P < 0.01, ***P < 0.001, ****P < 0.0001, analyzed by two-way ANOVA with Tukey’s multiple comparison test. (G) A model illustrating Ca2+ influx-mediated WNK1 signaling through Piezo1.

References

    1. Yang C. L., Angell J., Mitchell R., Ellison D. H., WNK kinases regulate thiazide-sensitive Na-Cl cotransport. J. Clin. Invest. 111, 1039–1045 (2003). - PMC - PubMed
    1. Moriguchi T., et al. , WNK1 regulates phosphorylation of cation-chloride-coupled cotransporters via the STE20-related kinases, SPAK and OSR1. J. Biol. Chem. 280, 42685–42693 (2005). - PubMed
    1. Vitari A. C., Deak M., Morrice N. A., Alessi D. R., The WNK1 and WNK4 protein kinases that are mutated in Gordon’s hypertension syndrome phosphorylate and activate SPAK and OSR1 protein kinases. Biochem. J. 391, 17–24 (2005). - PMC - PubMed
    1. Anselmo A. N., et al. , WNK1 and OSR1 regulate the Na+, K+, 2Cl- cotransporter in HeLa cells. Proc. Natl. Acad. Sci. U.S.A. 103, 10883–10888 (2006). - PMC - PubMed
    1. Wilson F. H., et al. , Human hypertension caused by mutations in WNK kinases. Science 293, 1107–1112 (2001). - PubMed

LinkOut - more resources