. 2025 Aug 13:15:1615182.
doi: 10.3389/fcimb.2025.1615182. eCollection 2025.

Endometrial microbiome during early pregnancy among women with and without chronic endometritis: a pilot study

Affiliations

Endometrial microbiome during early pregnancy among women with and without chronic endometritis: a pilot study

Hong Gao et al. Front Cell Infect Microbiol. .

Abstract

Introduction: Although chronic endometritis (CE) is strongly associated with infertility and adverse pregnancy outcomes, the specific microbiome of women with CE who can conceive remain unclear.

Methods: This study recruited 100 participants aged 18 to 45 years with spontaneously conceived pregnancy who opted for pregnancy termination, detected their endometrial microbiome by 16S rRNA, and made a diagnosis of CE.

Results: Among them, 19 were diagnosed with CE. There was a comparable microbial composition within the endometrium between women with and without CE. The relative abundance of Sphingomonas (21%) and Pseudomonas (8%) were the same in both groups. Compared to women without CE, women with CE exhibited higher abundance of Faecalibacterium (6.5% vs 3.8%), Escherichia-Shigella (3.3% vs 2.6%), Akkermansia (1.65% vs 1.1%), and lower abundance of Lactobacillus (10% vs 14%), and Corynebacterium (1.35% vs 2.15%) at the genus level. Streptococcus, Escherichia-Shigella, Akkermansia and Finegoldia exhibited significant interactions with other microbiome in participants with CE.

Discussion: In women with CE, reproductive potential may be associated with the compositional stability of the endometrial microbiome, whereas an imbalance in the abundance of these microbes may be linked to their pregnancy outcomes.

Keywords: 16S rRNA; chronic endometritis; early pregnancy; endometrial microbiome; host factors.


Conflict of interest statement

The authors declare that the research was conducted in the absence of any commercial or financial relationships that could be construed as a potential conflict of interest.

Figures

Figure 1
Figure 1
The diversity of the endometrial microbiome communities between participants with CE and those without (n=100) (A, B) the alpha diversity of endometrial microbiome (A), Chao1 diversity index; (B), Shannon diversity index) between participants with CE and those without. Box-plot elements consist of the median (represented by the center line), upper and lower quartiles (depicted as box limits), and 1.5×the interquartile range (shown as whiskers). (C) the beta diversity of endometrial microbiome was analyzed using Principal Coordinate Analysis (PCoA) between participants with CE and those without. PCoA was based on Bray-Curtis distances to analyze the microbial composition of endometrium. Each dot on the PCoA plot represents a single sample, with different colors indicating distinct sample groups. The 95% confidence intervals (CI) are represented by ellipses, R2 = 0.01, P=0.823. Statistical significance for correlations was determined using Spearman’s test with FDR correction (adjusted P < 0.05). N_CE, non-chronic endometritis; CE, chronic endometritis.
Figure 2
Figure 2
The composition, relative abundance, and differences of endometrial microbiome between participants with CE and those without (A) The composition of the top 20 microbial genera in the endometrium between participants with CE and those without. Each bar represents a distinct participant. (B) The rank of the Gini index from the random forest model. (C) Differences in the top 30 endometrial microbial genera between participants with and without CE. Linear discriminant analysis (LDA) and effect size (LEfSe) analysis were conducted to identify endometrial microbial biomarkers differentiating participants with and without CE. Features with an absolute log LDA score >4.0 and a false discovery rate (FDR)–adjusted P-value<0.05 (using the Benjamini–Hochberg correction) were considered statistically significant. CE, chronic endometritis; N_CE, non-chronic endometritis. (D) The ROC curves created by the potential biomarkers with relatively high Gini indices in B highlight the performance of the classifier at different cut-off points. The ROC curve visually describes the discriminative ability of the classifier by demonstrating the trade-off between sensitivity and specificity at different thresholds.
Figure 3
Figure 3
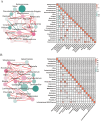
Co-occurrence networks of endometrial microbiome in participants with and without CE Co-occurrence networks of endometrial microbiome were drawn for the top 20 microbial genera in participants with (A) and without CE (B). Each microbial genus network was established by calculating the co-occurring microbial communities with significant Spearman Correlation coefficients. In the network diagrams on the left, the circle size represents the standardized relative abundance; the colour of a node represents the degree of interactions between this node and other nodes, and the redder the colour, the more its interactions with other nodes; the thickness of the line between nodes represents the P value of Spearman Correlation, ranging from the most significant (thicker) to the least significant (thinner). Red lines indicate positive correlations and green lines indicate negative correlations. In the correlation graph on the right, the size of the circle and colour intensity are directly proportional to their corresponding Spearman correlation coefficients. No circle in a pair of microbiome means no correlation. * = significant correlations (Benjamini-Hochberg corrected P<0.05), *0.01<P<0.05, **0.001<P<0.01, ***P<0.001.
Figure 4
Figure 4
The relationship between the relative abundances of the top 20 endometrial microbial genera and host factors in participants with and without CE Each red square represents a positive correlation, while each green square represents a negative correlation. P values were acquired by the Spearman test. (A), Correlations between the top 20 endometrial microbial genera and 6 host factors (120 comparisons) among participants with CE. (B), Correlations between the top 20 endometrial microbial genera and 6 host factors (120 comparisons) among participants without CE. Multiple-hypothesis testing was corrected using the Benjamini-Hochberg method to control the false discovery rate (FDR).
Figure 5
Figure 5
Comparative analysis on the relative abundance of endometrial microbiome under different host factors in participants with CE (n=19) (A–D), the distribution and relative abundance of endometrial microbiome in patients with CE under different host factors. Box-plot elements include: median (center line), upper and lower quartiles (box limits), 1.5×interquartile range (whiskers); P values were determined by two-tailed Welch’s t test. Multiple-hypothesis testing was corrected using the Benjamini-Hochberg method to control the false discovery rate (FDR). *, FDR<0.05, **FDR<0.01, ***FDR<0.001.

References

    1. Anderson M. J. (2008). A new method for non-parametric multivariate analysis of variance. Austral Ecology. 26, 32–46. doi: 10.1046/j.1442-9993.2001.01070.x - DOI
    1. Ang C. J., Skokan T. D., McKinley K. L. (2023). Mechanisms of regeneration and fibrosis in the endometrium. Annu. Rev. Cell Dev. Biol. 39, 197–221. doi: 10.1146/annurev-cellbio-011723-021442, PMID: - DOI - PMC - PubMed
    1. Artym J., Zimecki M. (2021). Antimicrobial and prebiotic activity of lactoferrin in the female reproductive tract: A comprehensive review. Biomedicines. 9, 1940. doi: 10.3390/biomedicines9121940, PMID: - DOI - PMC - PubMed
    1. Bolyen E., Rideout J. R., Dillon M. R., Bokulich N. A., Abnet C. C., Al-Ghalith G. A., et al. (2019). Reproducible, interactive, scalable and extensible microbiome data science using QIIME 2. Nat. Biotechnol. Aug 37, 852–857. doi: 10.1038/s41587-019-0209-9, PMID: - DOI - PMC - PubMed
    1. Brown R. G., Al-Memar M., Marchesi J. R., Lee Y. S., Smith A., Chan D., et al. (2019). Establishment of vaginal microbiota composition in early pregnancy and its association with subsequent preterm prelabor rupture of the fetal membranes. Transl. Res. May 207, 30–43. doi: 10.1016/j.trsl.2018.12.005, PMID: - DOI - PMC - PubMed

Substances

LinkOut - more resources