. 2025 Aug 13:16:1627656.
doi: 10.3389/fphar.2025.1627656. eCollection 2025.

Cepharanthine hydrochloride inhibits prostate cancer progression by modulating gut microbiota and metabolites

Affiliations

Cepharanthine hydrochloride inhibits prostate cancer progression by modulating gut microbiota and metabolites

Hui Li et al. Front Pharmacol. .

Abstract

Background: Cepharanthine Hydrochloride (CH) is widely used in clinical settings to alleviate leukopenia caused by various tumors following radiotherapy and chemotherapy. However, it remains unclear whether CH have an inhibitory effect on the progression of prostate cancer, and whether this effect is mediated by gut microbiota. To address this question, the present study constructed normal mouse models of prostate cancer, as well as antibiotic-treated mouse models of prostate cancer.

Methods: CH were then administered via gavage to both groups of model mice. After treatment, the tumor sizes of the mice were measured, and feces, blood, and tumor tissues from both groups were collected for 16S rDNA, metabolomics, and transcriptomics sequencing analysis.

Results: Results showed CH treatment significantly suppressed prostate cancer growth in mice without antibiotic cocktail pretreatment, but not in antibiotic-pretreated mice. 16S rRNA sequencing revealed distinct gut microbiota alterations in CH-Ctrl versus Ctrl/CH-ABX groups, with increased g_Blautia, g_Lactobacillus, g_Butyricicoccus and decreased g_Akkermansia abundances. Metabolomic analysis identified 240 and 123 differentially abundant metabolites in CH-Ctrl vs Ctrl and CH-ABX, respectively. RNA-seq detected 579 and 530 differentially expressed genes in CH-Ctrl vs Ctrl and CH-ABX, respectively. Correlation analysis of differential gut microbiota, metabolites, and genes suggested that CH might inhibit prostate cancer growth by increasing the relative abundance of g_Blautia, g_Lactobacillus, and g_Butyricicoccus, suppressing g_Akkermansia proliferation, enhancing Acetylglycine metabolite production, upregulating Ttpa, Gm14964, Shc3, Elovl4 gene expression, and downregulating Gm10531, Bc021767 gene expression.

Conclusion: This study is the first to explore the potential mechanisms of gut microbiota-mediated CH treatment for prostate cancer, providing a scientific basis for the application of CH in PCa therapy.

Keywords: antibiotic cocktail; cepharanthine hydrochloride; gut microbiota; metabolites of gut microbiota; prostate cancer.


Conflict of interest statement

The authors declare that the research was conducted in the absence of any commercial or financial relationships that could be construed as a potential conflict of interest.

Figures
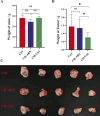
FIGURE 1
FIGURE 1
CH treatment significantly inhibited the growth of prostate tumors in mice. (A) Comparison of body weight among the three groups after treatment; (B) Comparison of tumor weight among the three groups after treatment; (C) Gross morphology of prostate tumors from the three groups after treatment. ns p > 0.05 *p ≤ 0.05, **p < 0.01, ***p < 0.001, n = 5.
FIGURE 2
FIGURE 2
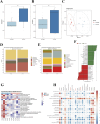
Comparison of gut microbiota between the Ctrl and CH-Ctrl groups. (A,B) Comparison of α-diversity indices between groups; (C) PLS-DA analysis of the two groups; (D) Relative abundance bar plot of gut microbiota at phylum level (>0.1% abundance); (E) Relative abundance bar plot of gut microbiota at genus level (>1% abundance); (F) LEfSe analysis showing significantly discriminant taxa between groups (LDA score ≥2.5); (G) Heatmap of significantly different KEGG pathways between groups; (H) Correlation heatmap between significantly different genus-level microbiota and metabolic pathways. ns p > 0.05 *p ≤ 0.05, **p < 0.01, ***p < 0.001, n = 5.
FIGURE 3
FIGURE 3
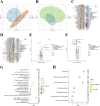
Comparison of gut microbiota between the Ctr-ABX and CH-Ctrl groups. (A,B) Comparison of α-diversity indices between groups; (C) Principal coordinates analysis (PCoA) of the two groups; (D) Bar plot showing relative abundance of gut microbiota at phylum level (>0.1% abundance); (E) Bar plot showing relative abundance of gut microbiota at genus level (>1% abundance); (F) LEfSe analysis of significantly discriminant taxa between groups (LDA score ≥2.5); (G) Heatmap of significantly different KEGG pathways between groups; (H) Heatmap showing correlations between significantly different genus-level microbiota and metabolic pathways. ns p > 0.05 *p ≤ 0.05, **p < 0.01, ***p < 0.001, n = 5.
FIGURE 4
FIGURE 4
Comparison of intestinal metabolites between groups. (A,B) Principal component analysis (PCA) between groups; (C,D) Hierarchical clustering heatmap of differential metabolites between groups; (E,F) Volcano plots of inter group metabolite differences (differential metabolites screened by p-value + VIP criteria, with red indicating upregulation and blue indicating downregulation); (G) KEGG pathway bubble plot for CH-Ctrl vs. Ctrl differential metabolites (bubble size represents the number of differential metabolites annotated to each pathway, color intensity corresponds to adjusted p-values with blue-to-red gradient indicating increasing significance); (H) KEGG pathway bubble plot for CH-ABX vs. CH-Ctrl differential metabolites (with identical representation scheme as panel (G)). ns p > 0.05 *p ≤ 0.05, **p < 0.01, ***p < 0.001, n = 5.
FIGURE 5
FIGURE 5
Analysis of differential genes between the CH-Ctrl vs. Ctrl groups (A) Volcano plot of differentially expressed genes, with the x-axis representing fold change in gene expression and the y-axis indicating the statistical significance of expression changes. Data points represent individual genes: gray denotes non-significant differences, red indicates significantly upregulated genes, and blue represents significantly downregulated genes; (B) Bubble plot of the top 20 significantly enriched KEGG pathways (upregulated); (C) Bubble plot of the top 20 significantly enriched KEGG pathways (downregulated); (D) Bubble plot of the top 30 significantly enriched GO terms (upregulated); (E) Bubble plot of the top 30 significantly enriched GO terms (downregulated). In all bubble plots, the Rich factor is represented by point color (gradient from low to high values corresponding to blue to red), while the size of each point reflects the number of differentially expressed genes annotated to each KEGG pathway/GO term. ns p > 0.05 *p ≤ 0.05, **p < 0.01, ***p < 0.001, n = 5.
FIGURE 6
FIGURE 6
Analysis of differential genes between the CH-ABX vs. CH-Ctrl groups. (A) Volcano plot of differentially expressed genes, with the x-axis representing fold change in gene expression and the y-axis indicating the statistical significance of expression changes. Data points represent individual genes: gray denotes non-significant differences, red indicates significantly upregulated genes, and blue represents significantly downregulated genes; (B) Bubble plot of the top 20 significantly enriched KEGG pathways (upregulated); (C) Bubble plot of the top 20 significantly enriched KEGG pathways (downregulated); (D) Bubble plot of the top 30 significantly enriched GO terms (upregulated); (E) Bubble plot of the top 30 significantly enriched GO terms (downregulated). In all bubble plots, the Rich factor is represented by point color (gradient from low to high values corresponding to blue to red), while the size of each point reflects the number of differentially expressed genes annotated to each KEGG pathway/GO term. ns p > 0.05 *p ≤ 0.05, **p < 0.01, ***p < 0.001, n = 5.
FIGURE 7
FIGURE 7
Pairwise correlation analysis among differential gut microbiota, intestinal metabolites, and genes (a) Correlation analysis between differential gut microbiota and intestinal metabolites; (b) Correlation network of differential gut microbiota and metabolites; (c) Correlation analysis between differential intestinal metabolites and genes; (d) Correlation network of differential metabolites and genes; (e) Correlation analysis between differential gut microbiota and genes; (f) Correlation network of differential microbiota and genes. Red markers indicate significantly correlated differential gut microbiota, metabolites, and genes potentially involved in CH-mediated suppression of PCa growth. (g) Schematic that the “microbiota-metabolome-transcriptome” axis. ns p > 0.05 *p ≤ 0.05, **p < 0.01, ***p < 0.001, n = 5.

Similar articles

References

    1. Abdelaal A. M., Sohal I. S., Iyer S. G., Sudarshan K., Orellana E. A., Ozcan K. E., et al. (2024). Selective targeting of chemically modified miR-34a to prostate cancer using a small molecule ligand and an endosomal escape agent. Mol. Ther. Nucleic Acids 35 (2), 102193. 10.1016/j.omtn.2024.102193 - DOI - PMC - PubMed
    1. Amstalden V. H. E., Blackwell T. R., Klinkert I., Eijkel G. B., Heeren R. M., Glunde K. (2010). Multimodal mass spectrometric imaging of small molecules reveals distinct spatio-molecular signatures in differentially metastatic breast tumor models. Cancer Res. 70 (22), 9012–9021. 10.1158/0008-5472.CAN-10-0360 - DOI - PMC - PubMed
    1. Bai X. F., Hu J., Wang M. F., Li L. G., Han N., Wang H., et al. (2024). Cepharanthine triggers ferroptosis through inhibition of NRF2 for robust ER stress against lung cancer. Eur. J. Pharmacol. 979, 176839. 10.1016/j.ejphar.2024.176839 - DOI - PubMed
    1. Bray F., Laversanne M., Sung H., Ferlay J., Siegel R. L., Soerjomataram I., et al. (2024). Global cancer statistics 2022: GLOBOCAN estimates of incidence and mortality worldwide for 36 cancers in 185 countries. CA Cancer J. Clin. 74 (3), 229–263. 10.3322/caac.21834 - DOI - PubMed
    1. Cai M., Song X. L., Li X. A., Chen M., Guo J., Yang D. H., et al. (2023). Current therapy and drug resistance in metastatic castration-resistant prostate cancer. Drug Resist Updat 68, 100962. 10.1016/j.drup.2023.100962 - DOI - PubMed

LinkOut - more resources