. 2025 Aug 13:16:1656100.
doi: 10.3389/fmicb.2025.1656100. eCollection 2025.

Ellagic acid on milk production performance, blood and milk hormones, antioxidant capacity and fecal microbial communities in lactating Yili mares

Affiliations

Ellagic acid on milk production performance, blood and milk hormones, antioxidant capacity and fecal microbial communities in lactating Yili mares

Xinxin Huang et al. Front Microbiol. .

Abstract

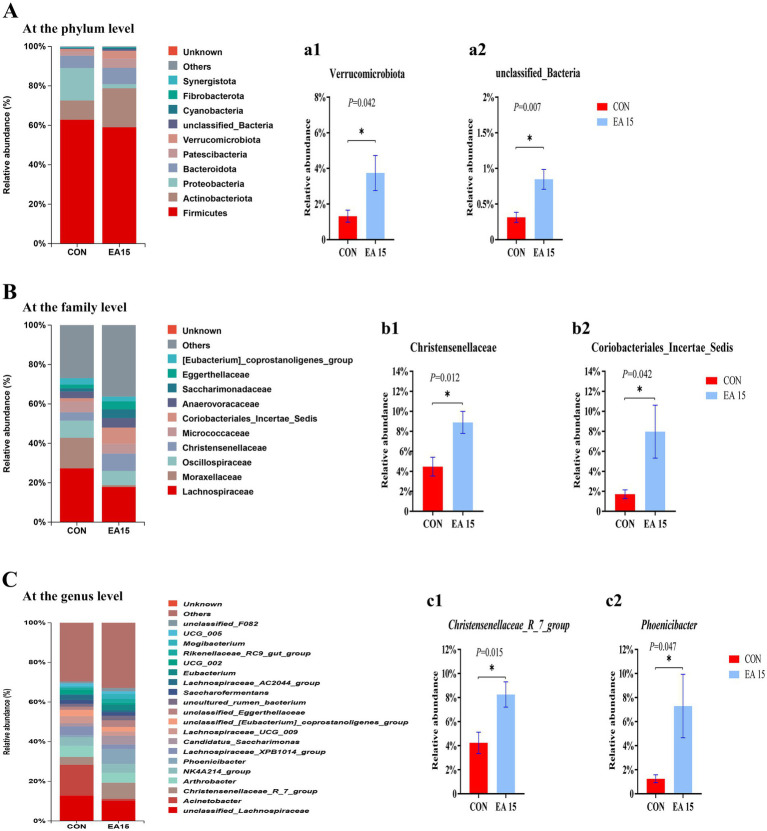
Ellagic acid (EA), a natural polyphenol, exerts potent antioxidant and anti-inflammatory effects in humans and other animals, while contributing to intestinal microbiota homeostasis. This study investigated the impact of EA supplementation on milk production, hormone secretion, antioxidant activity, and gut microbiota in lactating Yili mares. Eighteen lactating Yili mares with an average body weight of 400.06 ± 15.01 kg, average age of 9.89 ± 0.83 years, with similar parity (5-6 foalings) were used in this study. These mares had foaled in May (first foal born on May 7, last foal born on May 13) and had been lactating for 30 days at the initiation of the experiment. They were randomly allocated to 3 groups (n = 6 per group): a control group (CON) receiving no EA supplementation, the EA15 group (15 mg/kg BW/day EA), and the EA30 group (30 mg/kg BW/day EA). The supplementation trial commenced on lactation day 30 (study day 0) and continued for 90 days. By study days 60 and 90, EA supplementation enhanced milk production in lactating mares. On study day 30, serum prolactin (PRL) concentrations were increased in mares in the EA15 group, and milk PRL concentrations were increased in mares in the EA30 group compared to the CON group of mares. Conversely, serum luteinizing hormone (LH) concentrations and milk growth hormone (GH) concentrations were reduced. Compared to the CON group of mares, mares in the EA15 group had increased serum glutathione peroxidase (GSH-Px) activity, and mares in the EA30 group had increased milk superoxide dismutase (SOD) and catalase (CAT) activities, while reducing milk total antioxidant capacity (T-AOC) and malondialdehyde (MDA) levels. Supplementation with EA increased the relative abundance of Actinobacteriota, Verrucomicrobiota, Christensenellaceae, Coriobacteriales_Incertae_Sedis, Christensenellaceae_R_7_group, and Phoenicibacter in the feces of lactating mares, while decreasing the relative abundance of Proteobacteria, Moraxellaceae, and Acinetobacter. Overall, EA supplementation increases milk production in lactating Yili mares, modulates lactation-associated hormone secretion, improves the body's antioxidant capacity, and alters the composition of the intestinal microflora. The results suggest potential applications of EA supplementation in equine nutrition strategies aimed at improving lactation performance and antioxidant status during lactation. Future research could focus on optimizing dosage regimens and validating its efficacy in larger-scale production systems to facilitate practical application in equine husbandry.

Keywords: Yili mares; antioxidant; ellagic acid; fecal microorganism; hormones; lactation performance.


Conflict of interest statement

The authors declare that the research was conducted in the absence of any commercial or financial relationships that could be construed as a potential conflict of interest.

Figures

Figure 1
Figure 1
Effect of supplemental EA on serum and milk hormone concentrations in lactating mares on day 30 of the experiment. Effect of supplemental EA on serum and milk E2 concentrations in lactating mares (A), serum and milk PROG concentrations (B), serum and milk PRL concentrations (C), serum and milk LH concentrations (D), serum and milk GH concentrations (E). Values are means with their standard errors represented by vertical bars. Different letters in the same bar chart represent significant differences (a–cp < 0.05). E2, estradiol; PROG, progesterone; PRL, prolactin; LH, luteinizing hormone; GH, growth hormone. CON: the control group, receiving no EA supplementation (n = 6); EA 15: the EA 15 group, each mare was supplemented with EA 15 mg/kg BW every day (n = 6); EA 30: the EA 30 group, each mare was supplemented with EA 30 mg/kg BW every day (n = 6).
Figure 2
Figure 2
Effect of supplemental EA on antioxidant capacity in serum and milk of lactating mares on day 30 of the experiment. Effect of supplemental EA on serum and milk SOD activity in lactating mares (A), serum and milk GSH-Px activity (B), serum and milk CAT activity (C), serum and milk T-AOC concentrations (D), serum and milk MDA concentrations (E). Values are means with their standard errors represented by vertical bars. Different letters in the same bar chart represent significant differences (a,bp < 0.05). SOD, superoxide dismutase; GSH-Px, glutathione peroxidase; CAT, catalase; T-AOC, total antioxidant capacity; MDA, malondialdehyde. CON: the control group, receiving no EA supplementation (n = 6); EA 15: the EA 15 group, each mare was supplemented with EA 15 mg/kg BW every day (n = 6); EA 30: the EA 30 group, each mare was supplemented with EA 30 mg/kg BW every day (n = 6).
Figure 3
Figure 3
Effect of supplemental EA on the alpha diversity of fecal bacteria in lactating mares on day 30 of the experiment. (A–F) Alpha diversity metrics. (A) Coverage. (B) Chao1. (C) ACE. (D) Shannon. (E) Simpson. (F) PD_whole_tree indexes for fecal microbiota of lactating mares. Values are means with their standard errors represented by vertical bars. CON: the control group, receiving no EA supplementation (n = 6); EA 15: the EA 15 group, each mare was supplemented with EA 15 mg/kg BW every day (n = 6).
Figure 4
Figure 4
Effect of supplemental EA on the beta diversity of fecal bacteria in lactating mares. (A–C) Beta diversity metrics. (A) PCA based on the OTU level. Points of different colors or shapes represent different sample grouping situations, a shorter distance between sample points indicates greater similarity of bacteria (n = 6 for each group). (B) PCoA plot based on weighted UniFrac distances with PERMANOVA analysis. (C) NMDS plot based on weighted UniFrac distances. PCA, principal component analysis; PCoA, principal coordinate analysis; NMDS, nonmetric multidimensional scaling. CON: the control group, not supplemented with EA (n = 6); EA 15: the EA 15 group, each mare was supplemented with EA 15 mg/kg BW every day (n = 6).
Figure 5
Figure 5
Effect of supplemental EA on the relative abundance of fecal bacteria at different taxonomic levels in lactating mares on day 30 of the experiment. (A) Microbiota composition at the phylum level. (a1,a2) Column plots indicate that the relative abundance of bacteria at the phylum level was significantly different between the CON and EA15 groups. (B) Microbiota composition at the family level. (b1,b2) Column plots indicate that the relative abundance of bacteria at the family level was significantly different between the CON and EA15 groups. (C) Microbiota composition at the genus level. (c1,c2) Column plots indicate that the relative abundance of bacteria at the genus level was significantly different between the CON and EA15 groups. For a1–c2, statistical significance was determined using t-test, and values are means with their standard errors represented by vertical bars. *p < 0.05. CON: the control group, receiving no EA supplementation (n = 6); EA 15: the EA 15 group, each mare was supplemented with EA 15 mg/kg BW every day (n = 6).
Figure 6
Figure 6
Effect of supplemental EA on the LEfSe of fecal bacteria in lactating mares on day 30 of the experiment. Linear discriminant analysis (LDA) distribution, and the score = 4 means significant. Cladogram of LEfSe shows taxonomic profiling from the phylum to species level, the yellow node represents no difference, but other color nodes represent significant difference. CON: the control group, receiving no EA supplementation (n = 6); EA 15: the EA 15 group, each mare was supplemented with EA 15 mg/kg BW every day (n = 6).
Figure 7
Figure 7
Effect of supplemental EA on fecal bacterial function prediction in lactating mares on day 30 of the experiment. Tax4Fun functional clustering heatmap prediction of fecal microbiota. Red denotes higher enrichment while green denotes lower enrichment. CON: the control group, receiving no EA supplementation (n = 6); EA 15: the EA 15 group, each mare was supplemented with EA 15 mg/kg BW every day (n = 6).
Figure 8
Figure 8
Spearman’s correlation analysis between indicators. (A) Spearman’s correlation analysis mare milk production, milk composition, serum hormones and antioxidant capacity, milk hormones and antioxidant capacity and fecal fermentation parameters. Heatmap of Spearman’s correlations among mare milk production, milk composition, serum hormones and antioxidant capacity, milk hormones and antioxidant capacity, fecal fermentation parameters and fecal bacterial prediction function, and differential fecal microbiota at the phylum (B), and genus (C) levels. The red and blue panes represent positive and negative correlations, respectively. Color intensity indicates the Spearman’s r-value of correlations in each panel. The asterisks indicate significant correlations (*p < 0.05 and **p < 0.01).

Similar articles

References

    1. Aishwarya V., Solaipriya S., Sivaramakrishnan V. (2021). Role of ellagic acid for the prevention and treatment of liver diseases. Phytother. Res. 35, 2925–2944. doi: 10.1002/ptr.7001 - DOI - PubMed
    1. Akers R. M. (2006). Major advances associated with hormone and growth factor regulation of mammary growth and lactation in dairy cows. J. Dairy Sci. 89, 1222–1234. doi: 10.3168/jds.S0022-0302(06)72191-9 - DOI - PubMed
    1. Akers R. M. (2017). A 100-year review: mammary development and lactation. J. Dairy Sci. 100, 10332–10352. doi: 10.3168/jds.2017-12983 - DOI - PubMed
    1. Akhtar M., Chen Y., Ma Z., Zhang X., Shi D., Khan J. A., et al. (2022). Gut microbiota-derived short chain fatty acids are potential mediators in gut inflammation. Anim. Nutr. 8, 350–360. doi: 10.1016/j.aninu.2021.11.005, PMID: - DOI - PMC - PubMed
    1. Anderson J. R., Carroll I., Azcarate-Peril M. A., Rochette A. D., Heinberg L. J., Peat C., et al. (2017). A preliminary examination of gut microbiota, sleep, and cognitive flexibility in healthy older adults. Sleep Med. 38, 104–107. doi: 10.1016/j.sleep.2017.07.018, PMID: - DOI - PMC - PubMed

LinkOut - more resources