. 2025 Feb 14:10.1111/ajps.12945.
doi: 10.1111/ajps.12945. Online ahead of print.

Political diversity in U.S. police agencies

Affiliations

Political diversity in U.S. police agencies

Bocar Ba et al. Am J Pol Sci. .

Abstract

Partisans are divided on policing policy, which may affect officer behavior. We merge rosters from 99 of the 100 largest local U.S. agencies-over one third of local law enforcement agents nationwide-with voter files to study police partisanship. Police skew more Republican than their jurisdictions, with notable exceptions. Using fine-grained data in Chicago and Houston, we compare behavior of Democratic and Republican officers facing common circumstances. We find minimal partisan differences after correcting for multiple comparisons. But consistent with prior work, we find Black and Hispanic officers make fewer stops and arrests in Chicago, and Black officers use force less often in both cities. Comparing same-race partisans, we find White Democrats make more violent crime arrests than White Republicans in Chicago. Our results suggest that despite Republicans' preference for more punitive law enforcement policy and their overrepresentation in policing, partisan divisions often do not translate into detectable differences in on-the-ground enforcement.


Figures
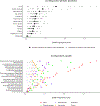
FIGURE 1
FIGURE 1
Partisanship as a predictor of policing attitudes. Note: The upper panel depicts the Shapley additive explanation importance score (SHAP importance, horizontal axis) of various respondent attributes (vertical axis) in predicting survey responses about policing in Pew (2016). Each small gray circle represents a policing attitude, with a vertical position indicating the attribute’s contribution to overall estimated responses (Amoukou, Brunel, and Tangi, 2022) in a gradient-boosted decision tree model (Chen & Guestrin, 2016). Large black diamonds represent the overall importance of the respondent attribute, averaging over all attitudes. Partisanship has the highest overall importance, roughly double that of ideology and race/ethnicity. The lower panel shows disaggregated importance scores (horizontal axis) for each policing attitude (vertical axis) with points for each respondent attribute. Partisanship is indicated with a red asterisk and other top-five predictors are indicated by colored dots; for clarity, less important attributes are shown only with gray dots. Partisanship is the most important predictor for a majority of policing attitudes.
FIGURE 2
FIGURE 2
Agency locations. Note: Included agencies cover roughly 220,000 officers across 32 states and Washington, D.C., representing 34% of the nation’s roughly 642,000 sworn local police officers and sheriffs’ deputies (Hyland & Davis, 2019). Together, jurisdictions covered in our data serve about 23% of the U.S. population. Each dot is scaled by the number of sworn officers.
FIGURE 3
FIGURE 3
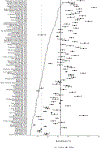
Average shares of Republicans among officers and civilians in the same jurisdictions. Note: Black dots are officer shares with 95% confidence intervals. Gray asterisks are civilian Republicans from L2 as a share of voting-age population from Census ACS. The vertical solid black line is the pooled officer mean. The vertical dotted gray line is the hypothetical officer mean if each officer was randomly drawn from their respective jurisdiction.
FIGURE 4
FIGURE 4
Average shares of Republican officers and civilians in officers’ assigned districts, in Chicago (panel a) and Houston (panel b). Note: Black dots are officer shares with 95% confidence intervals. Gray asterisks are civilian Republicans from L2 as a share of voting-age population from Census data. The vertical solid black line is the pooled officer mean. The vertical dotted gray line is the hypothetical officer mean if each officer was randomly drawn from their respective district.
FIGURE 5
FIGURE 5
Deployment effects in Chicago. Note: The plot displays the effect of deploying a Democrat vs. a Republican officer in similar circumstances on various outcomes. Unadjusted 95% confidence intervas with officer-clustered standard errors displayed. Estimates in gray are nonsignificant. Estimates in black were statistically significant prior to multiple testing corrections. Estimates in red remain significant after multiple testing corrections.
FIGURE 6
FIGURE 6
Deployment effects in Houston. Note: The plot displays the effect of deploying a Democrat vs. a Republican officerin similar circumstances on various outcomes. Unadjusted 95% confidence intervals with officer-clustered standard errors displayed. Estimates in gray are nonsignificant. Estimates in black were statistically significant prior to multiple testing corrections. Estimates in red remain significant after multiple testing corrections.
FIGURE 7
FIGURE 7
Deployment effects in Chicago within racial groups. Note: The plot displays the effect of deploying a Democrat vs. a Republican officer in similar circumstances on various outcomes, separately by racial/ethnic officer group. Unadjusted 95% confidence intervals with officer-clustered standard errors displayed. Estimates in gray are nonsignificant. Estimates in black were statistically significant prior to multiple testing corrections. Estimates in red remain significant after multiple testing corrections.
FIGURE 8
FIGURE 8
Deployment effects in Houston within racial groups. Note: The plot displays the effect of deploying a Democrat vs. a Republican officer in similar circumstances on various outcomes, separately by racial/ethnic officer group. Unadjusted 95% confidence intervals with officer-clustered standard errors displayed. Estimates in gray are nonsignificant. Estimates in black were statistically significant prior to multiple testing corrections. No estimates remain significant after multiple testing corrections.

References

    1. Adams IT, McCrain J, Schiff DS, Schiff KJ, and Mourtgos SM. 2024. “Police reform from the top down: Experimental evidence on police executive support for civilian oversight.” Journal of Policy Analysis and Management 51(4): 905–28.
    1. Amoukou Salim I., Nicolas J-B. Brunel, and Tangi Salaün. 2022. “Accurate Shapley Values for Explaining Tree-based Models.” Paper presented at Proceedings of the 25th International Conference on Artificial Intelligence and Statistics (AISTATS) 2022, Valencia, Spain.
    1. Aronow Peter M., and Samii Cyrus. 2016. “Does Regression Produce Representative Estimates of Causal Effects?.” American Journal of Political Science 60(1): 250–67.
    1. Ba Bocar A., Knox Dean, Mummolo Jonathan, and Rivera Roman G.. 2021. “The Role of Officer Race and Gender in Police-Civilian Interactions in Chicago.” Science 371(6530): 696–702. - PubMed
    1. Baumgartner Frank R., Bell Kate, Beyer Luke, Boldrin Tara, Doyle Libby, Govan Lindsey, Halpert Jack, Hicks Jackson, Kyriakoudes Katherine, Lee Cat, et al. 2021. “Intersectional Encounters, Representative Bureaucracy, and the Routine Traffic Stop.” Policy Studies Journal 49(3): 860–86.

LinkOut - more resources