. 2025 Aug 26:S1535-6108(25)00332-0.
doi: 10.1016/j.ccell.2025.08.001. Online ahead of print.

Multi-omic profiling of intraductal papillary neoplasms of the pancreas reveals distinct patterns and potential markers of progression

Affiliations

Multi-omic profiling of intraductal papillary neoplasms of the pancreas reveals distinct patterns and potential markers of progression

Yuefan Wang et al. Cancer Cell. .

Abstract

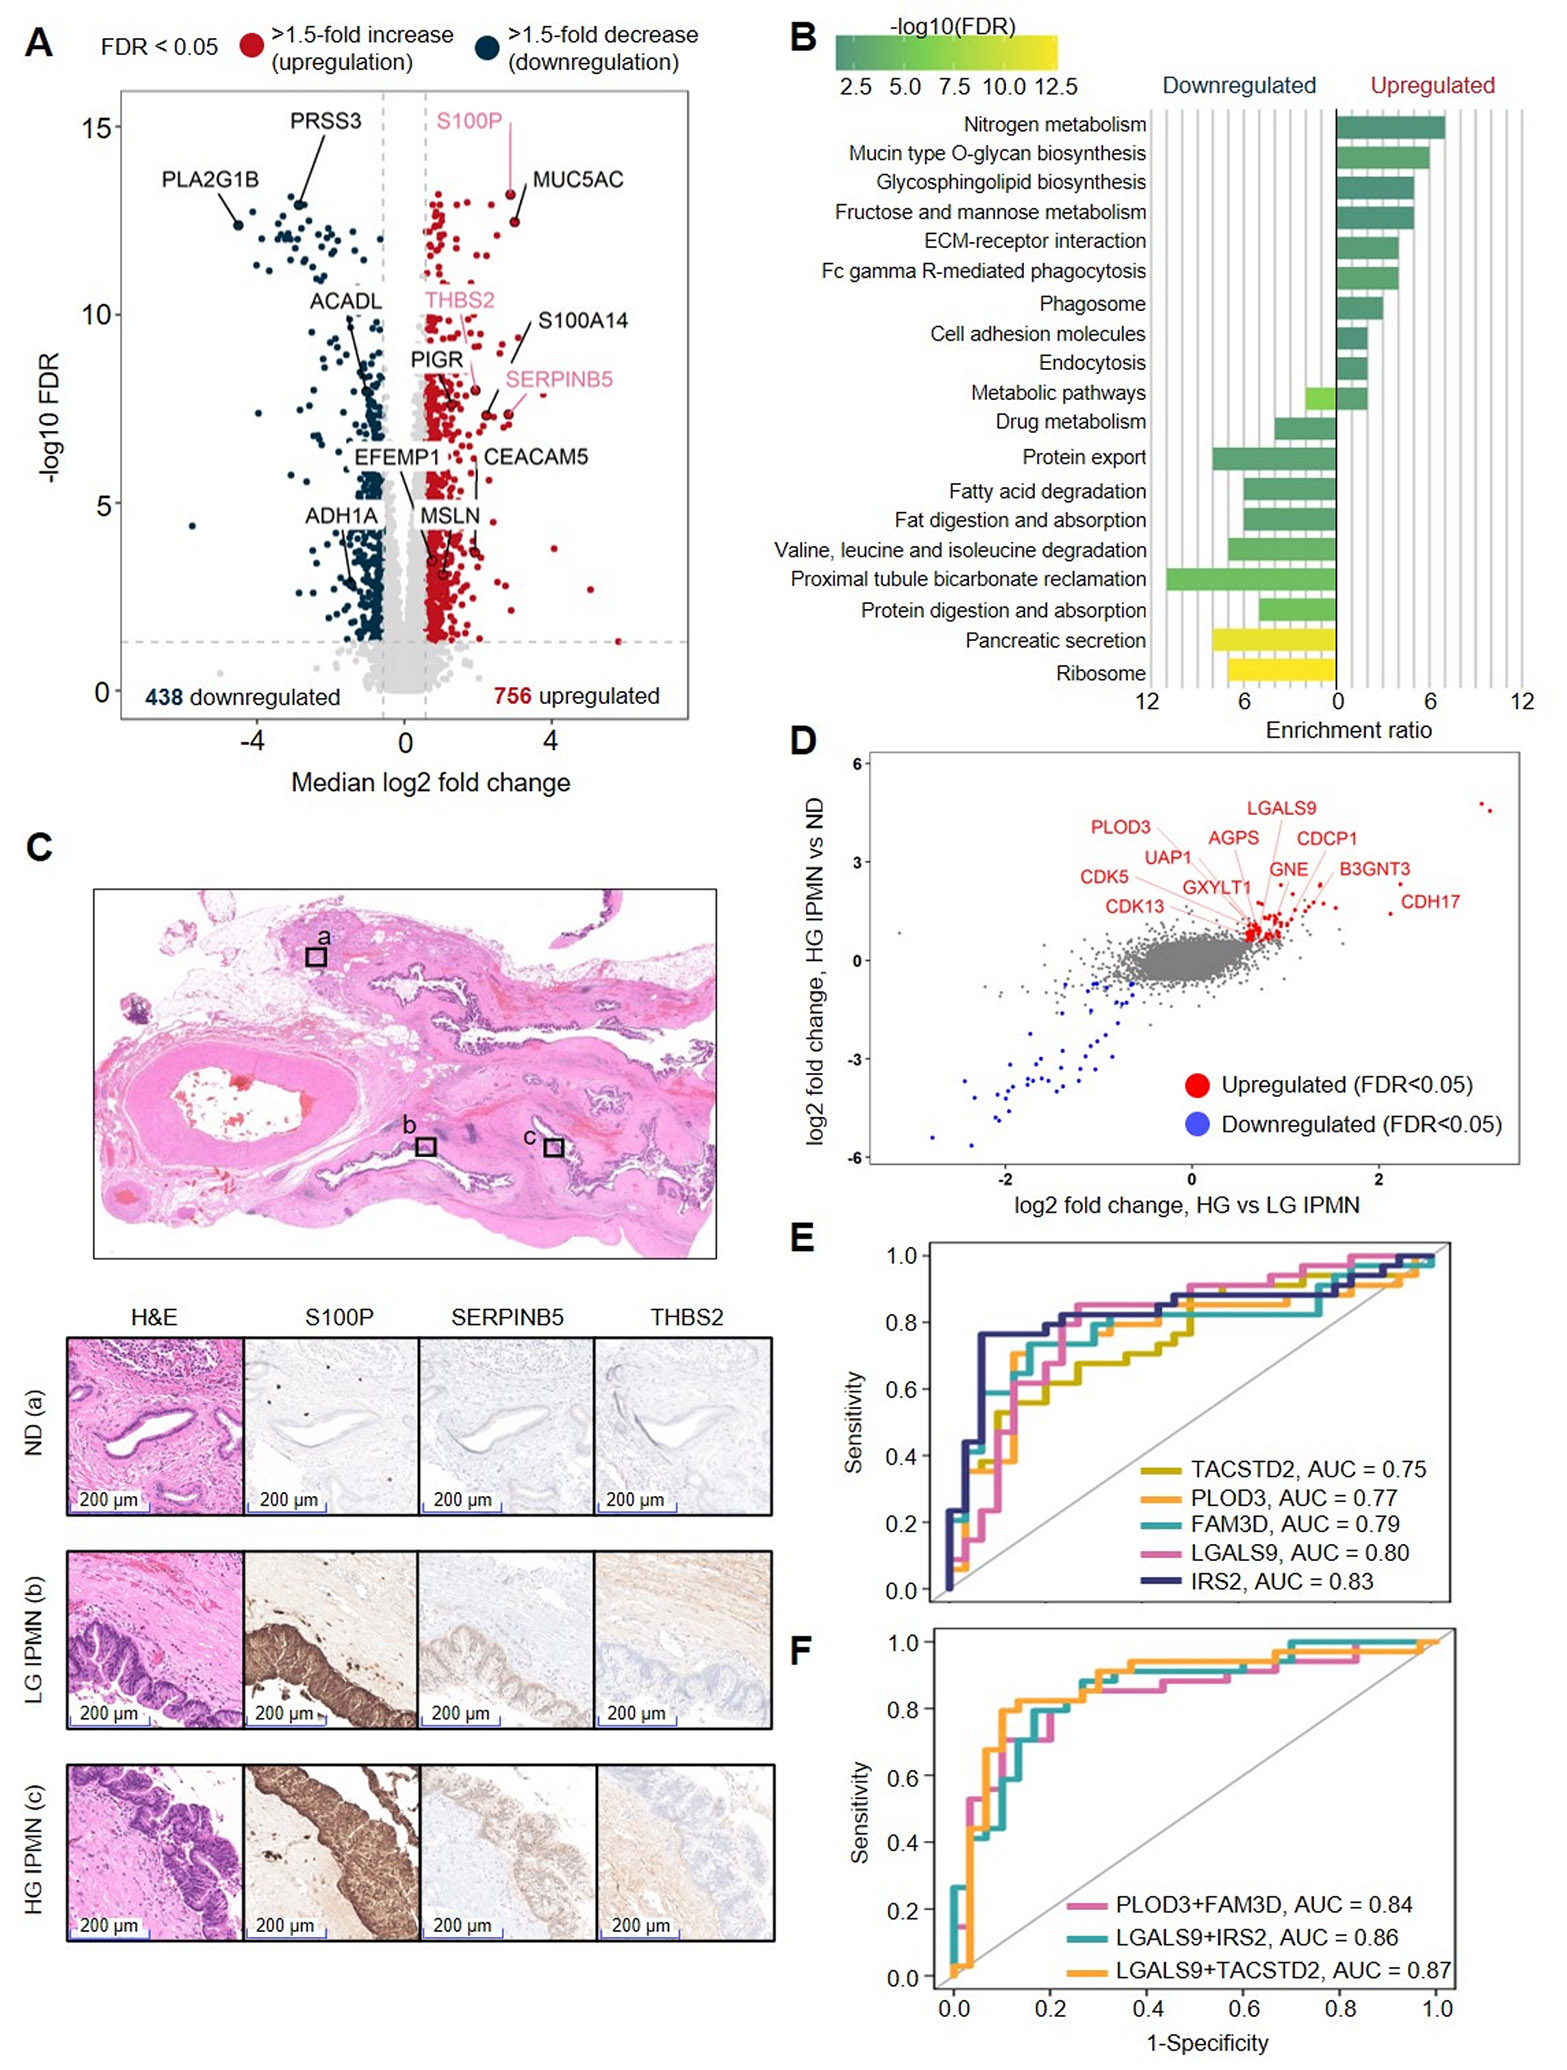
To enable early detection of pancreatic cancer from precancerous lesions, we analyze proteins and glycoproteins from 64 intraductal papillary mucinous neoplasms (IPMNs), 55 cyst fluid samples, 104 pancreatic ductal adenocarcinomas (PDACs), and various types of normal samples using mass spectrometry. High-grade IPMNs show enrichment of glycosylation level and tumor progression pathways compared to low-grade lesions. High-grade IPMN associated proteins, such as PLOD3, IRS2, LGALS9, and Trop-2, are identified and validated using immunolabeling and laser microdissection. Some high-grade associated proteins are also detected in pancreatic cyst fluids, which allows us to link proteins and glycoproteins expressed in neoplastic cells to clinically accessible biospecimens. Altered glycosylation level of extracellular matrix (ECM) proteins is observed in IPMNs compared to normal ducts. Additionally, we identify a subset of IPMNs with PDAC-like features, including elevated expression of ECM proteins. These findings offer insight into progression-associated proteins and emphasize the diagnostic and therapeutic potential of these proteins in pancreatic tumors.

Keywords: IPMN; early detection; extracellular matrix; glycoproteomics; pancreatic cancer; proteomics; tumor progression.


Conflict of interest statement

Declaration of interests R.H.H. has the potential to receive royalty payments from Thrive Diagnostics for the invention “Identification of GNAS mutations in pancreatic cystic lesions” in a relationship overseen by the Johns Hopkins University. A patent related to this work, titled “Biomarkers for Early Detection of Pancreatic Cancer and Use Thereof,” has been filed through Johns Hopkins University under case reference JHU Ref: C18948.

Figures

Figure 1.
Figure 1.. Landscape of the cohort.
A. Distribution of the cohort according to sample types, countries of origin, histologic subtypes, histologic grades, and available data types. B. Mutation landscape. C. Distribution of KRAS VAF and KRAS hotspot mutations. D. Distribution of GNAS hotspot mutations. E. Total global proteins and glycopeptides identified from tissues and cystic fluids of the entire cohort. Also see Figure S1 and Table S1.
Figure 2.
Figure 2.. Identification of IPMN- and grade-associated proteins and their detections in cyst fluids.
A. Comparison of 64 IPMNs and 76 normal duct tissues (NDs). Proteins with immunochemistry labeling are in pink. The p-values were computed using two-sided Wilcoxon rank sum test and adjusted (false discovery rate, FDR) using Benjamini-Hochberg method. B. KEGG pathway enriched by using upregulated and downregulated proteins in IPMN tissues relative to NDs. C. IHC labeling results of S100P, SERPINB5, and THBS2 in ND, low-grade (LG) IPMN, and high-grade (HG) IPMN. D. Significantly upregulated (red) and downregulated (blue) proteins in 34 HG IPMNs relative 30 to LG IPMNs and 76 NDs. Proteins associate with glycosylation/cancer progression are named in red. E. Individual proteins show potential clinical utilities for HG IPMN detection based on the ROC analysis. F. Multi-protein panels improve the performance of distinguishing HG IPMNs from LG IPMNs. The proteins and multi-protein panels in E and F are selected as examples. A comprehensive ROC results can be found in the corresponding supplementary table. Also see Figure S2 and Table S2.
Figure 3.
Figure 3.. Altered glycosylation in 53 IPMNs.
A. Comparison of glycopeptides in 53 IPMNs and 66 NDs. The p-values were computed using two-sided Wilcoxon rank sum test and adjusted using Benjamini-Hochberg method. B. Expression changes in glycopeptides in comparison to the changes in global protein levels (IPMN vs NDs). C. Significantly enriched GO biological functions of upregulated and downregulated glycopeptides in instances in which the proteins were unchanged at the global level. D. Examples of individual glycopeptides and combination of glycopeptides capable of differentiating IPMNs from NDs. E. glycopeptides with differential expression in KRAS-mutant IPMNs or both KRAS- and GNAS-mutant IPMNs compared to KRAS-wildtype (WT) and/or GNAS-WT IPMNs. Also see Figure S3 and Table S3.
Figure 4.
Figure 4.. Proteomic comparison between IPMNs and PDACs with high tumor cellularity.
A. PCA analysis of the cohort. B. IHC labeling results of S100P, SERPINB5, and THBS2 in PDAC tissue. C. Hierarchical clustering of 104 PDACs and 64 IPMNs, where 8 IPMNs with high association scores group with PDACs. D. Enriched GO biological processes using overexpressed and downregulated proteins in PDACs and IPMNs grouped with PDACs compared to the remaining IPMNs. E. Examples of the proteins showing significant changes between PDAC-associated IPMNs (n=8) grouped with PDACs (n=104) relative to non-PDAC associated IPMNs (n=56). F. PDAC-associated IPMNs and PDAC had abundant ECM proteins compared to non-PDAC associated IPMNs. The ECM proteins were also differentially expressed in PDAC-associated IPMNs and PDAC relative to non-PDAC associated IPMNs. G. ECM proteins differentially expressed in one of the NMF clusters that are disease-related and/or potential drug targets based on Human Protein Atlas. Also see Figure S4 and Table S4.

Update of

References

    1. Siegel RL, Giaquinto AN, and Jemal A (2024). Cancer statistics, 2024. CA Cancer J Clin 74, 12–49. 10.3322/caac.21820. - DOI - PubMed
    1. Rahib L, Smith BD, Aizenberg R, Rosenzweig AB, Fleshman JM, and Matrisian LM (2014). Projecting cancer incidence and deaths to 2030: the unexpected burden of thyroid, liver, and pancreas cancers in the United States. Cancer Res 74, 2913–2921. 10.1158/0008-5472.CAN-14-0155. - DOI - PubMed
    1. Rahib L, Wehner MR, Matrisian LM, and Nead KT (2021). Estimated Projection of US Cancer Incidence and Death to 2040. JAMA Netw Open 4, e214708. 10.1001/jamanetworkopen.2021.4708. - DOI - PMC - PubMed
    1. Quante AS, Ming C, Rottmann M, Engel J, Boeck S, Heinemann V, Westphalen CB, and Strauch K (2016). Projections of cancer incidence and cancer-related deaths in Germany by 2020 and 2030. Cancer Med 5, 2649–2656. 10.1002/cam4.767. - DOI - PMC - PubMed
    1. Huang J, Lok V, Ngai CH, Zhang L, Yuan J, Lao XQ, Ng K, Chong C, Zheng ZJ, and Wong MCS (2021). Worldwide Burden of, Risk Factors for, and Trends in Pancreatic Cancer. Gastroenterology 160, 744–754. 10.1053/j.gastro.2020.10.007. - DOI - PubMed

LinkOut - more resources