. 2025 Sep;26(9):e70237.
doi: 10.1002/acm2.70237.

Evaluation of electron Monte Carlo algorithm accuracy for dose calculations in extended source-to-surface distances electron beam therapy

Affiliations

Evaluation of electron Monte Carlo algorithm accuracy for dose calculations in extended source-to-surface distances electron beam therapy

Naohito Ono et al. J Appl Clin Med Phys. 2025 Sep.

Abstract

Background: Extending the source-to-surface distance (SSD) is an effective approach to cover a large irradiation area in electron beam therapy for large planning target volumes (PTVs). However, the accuracy of dose calculations at extended SSDs has not been fully validated.

Purpose: This study evaluated the dose calculation accuracy of the electron Monte Carlo (eMC) algorithm implemented in Varian's Eclipse radiation therapy planning system (RTPS) under extended SSD conditions.

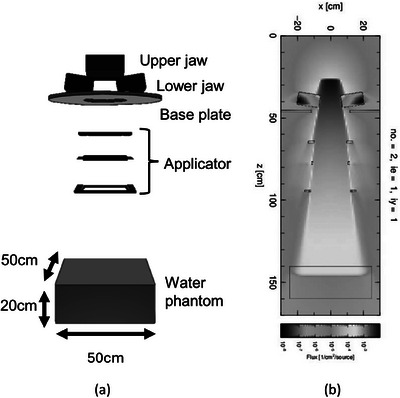
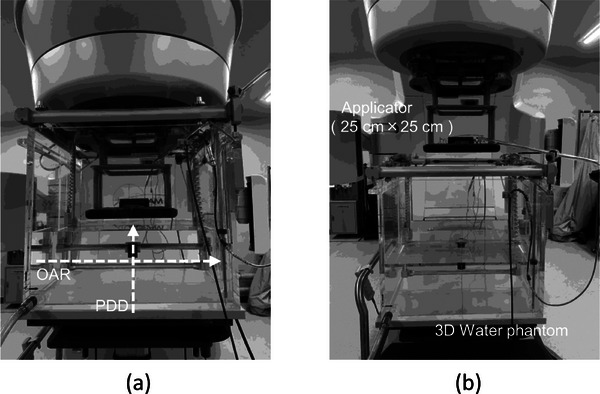
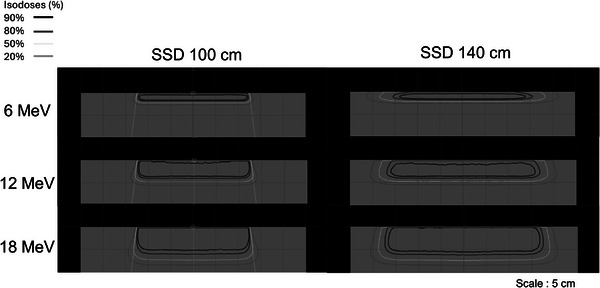
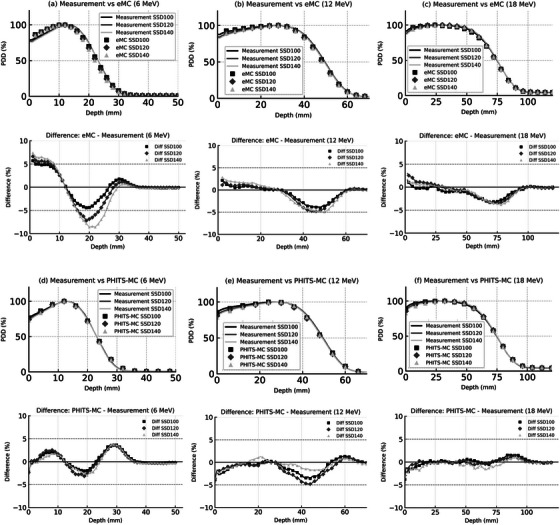
Methods: Simulations were conducted using Eclipse version 13.6 for 6, 12, and 18 MeV electron beams, with SSDs ranging from 100 to 140 cm. A 25 cm × 25 cm applicator and a virtual water phantom were utilized to compute percent depth dose (PDD), off-axis ratio (OAR), and output factor (OPF). The calculated values were compared with measured data and independent Monte Carlo (MC) simulations performed using Particle and Heavy Ion Transport System (PHITS), referred to as PHITS-MC in this study.

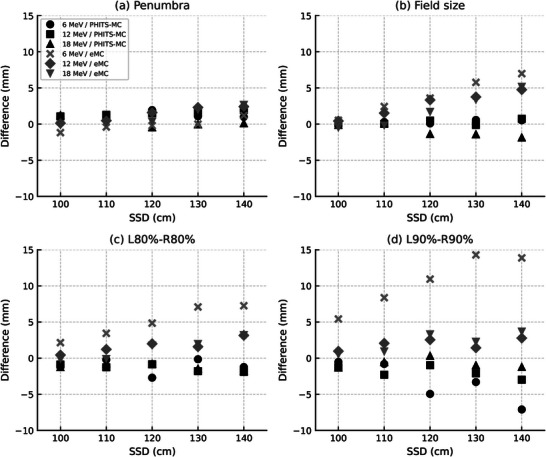
Results: The eMC algorithm achieved high accuracy along the central axis, with PDD deviations within 2 mm and OPF differences within 3% across all SSDs, including 140 cm. However, eMC exhibited increasing deviations in OAR field size (>3 mm) at SSD ≥ 120 cm. A detailed parameter-based analysis further revealed underperformance in OAR calculations at field peripheries for low-energy beams (6 MeV), compared with PHITS-MC.

Conclusion: The findings delineate the performance and limitations of the eMC algorithm under extended SSD conditions. These limitations should be considered in algorithm evaluation and quality assurance processes. The results provide guidance for algorithm assessment and may serve as a foundation for future studies to explore its clinical relevance in large-field electron beam therapy.

Keywords: Monte Carlo simulation; electron beam therapy; extended source‐to‐surface distance; radiation treatment planning system.


Conflict of interest statement

The first author and all co‐authors declare no conflicts of interest.

Figures

FIGURE 1
FIGURE 1
MC simulation of 12 MeV electron beam irradiation using PHITS (SSD 140 cm). (a) Modeling of the TrueBeam structure. (b) Fluence distribution of the electron beam.
FIGURE 2
FIGURE 2
Configuration of the 3D water phantom during PDD and OAR measurements. (a) SSD 100 cm. (b) SSD 140 cm.
FIGURE 3
FIGURE 3
Dose distribution of electron beam irradiation simulated using eMC (SSD 100 and 140 cm). The isodose curves represent 90%, 80%, 50%, and 20% of the dose, normalized to 100% at Dmax under each condition.
FIGURE 4
FIGURE 4
(a) PDD curves for 6, 12, and 18 MeV electron beams. Each curve is normalized to its respective Dmax. (b) OAR profiles assessed at Dmax and normalized to the corresponding CAX dose value for each energy. To facilitate visual comparison of dose distributions across different energies, energy‐specific vertical offsets (e.g., 100%, 120%, 140%) were employed. This method is consistent with Rodrigues et al. (2016, Med Phys) and does not imply differences in absolute dose.
FIGURE 5
FIGURE 5
PDD profiles at SSDs of 100, 120, and 140 cm for 6, 12, and 18 MeV electron beams. Panels (a)–(c) compare measurement and eMC simulation results at 6, 12, and 18 MeV, respectively. Panels (d)–(f) show corresponding comparisons between measurement and PHITS‐MC simulation results. All profiles are normalized to their respective Dmax to enable direct comparison. Solid lines indicate measured data, while simulation results are shown using markers. Square, diamond, and triangle markers represent SSDs of 100, 120, and 140 cm, respectively, for both eMC and PHITS‐MC. For clarity, energy‐specific subplots are used to prevent overplotting and ensure readability. To enhance interpretability, each profile is accompanied by a corresponding difference plot, where the measured values are subtracted from the simulated ones (i.e., eMC − Measurement or PHITS‐MC − Measurement), allowing visualization of SSD‐dependent discrepancies.
FIGURE 6
FIGURE 6
OAR profiles at SSDs of 100, 120, and 140 cm for 6, 12, and 18 MeV electron beams. Panels (a)–(c) compare measured values with eMC simulations, and panels (d)–(f) compare measured values with PHITS‐MC simulations. The OAR values were normalized to 100% at the CAX for each energy. To ensure consistent comparison, all profiles are plotted on the same scale (0%–120%). Black, dark gray, and light gray curves represent SSDs of 100, 120, and 140 cm, respectively. All OAR values were assessed at Dmax.
FIGURE 7
FIGURE 7
Differences between measured and calculated OAR‐derived parameters as a function of SSD for 6, 12, and 18 MeV electron beams. (a) Penumbra, (b) Field size, (c) L80%–R80% distance, and (d) L90%–R90% distance. Each symbol shape represents a specific energy and calculation method: circles, squares, and triangles indicate PHITS‐MC results, whereas crosses, diamonds, and inverted triangles represent eMC results. All OAR‐derived parameters were assessed at Dmax. Difference (mm) = Simulation value − Measurement value.

Similar articles

References

    1. International Commission on Radiation Units and Measurements (ICRU) . Radiation Dosimetry: Electrons with Initial Energies Between 1 and 50 MeV. ICRU Report No. 21; 1972.
    1. International Commission on Radiation Units and Measurements (ICRU) . Radiation Dosimetry: Electron Beams with Energies Between 1 and 50 MeV. ICRU Report No. 35; 1984.
    1. Xu Z, Walsh SE, Telivala TP, Meek AG, Yang G. Evaluation of the eclipse electron Monte Carlo dose calculation for small fields. J Appl Clin Med Phys. 2009;10(3):75‐85. doi: 10.1120/jacmp.v10i3.2834 - DOI - PMC - PubMed
    1. Lawrence SL, van Lieshout NHM, Charland PM. Assessment of Eclipse electron Monte Carlo output prediction for various topologies. J Appl Clin Med Phys. 2015;16(3):99‐106. doi: 10.1120/jacmp.v16i3.5036 - DOI - PMC - PubMed
    1. Zhang A, Wen N, Nurushev T, Burmeister J, Chetty IJ. Comprehensive evaluation and clinical implementation of commercially available Monte Carlo dose calculation algorithm. J Appl Clin Med Phys. 2013;14(2):127‐145. doi: 10.1120/jacmp.v14i2.4062 - DOI - PMC - PubMed

Publication types

LinkOut - more resources