. 2025 Aug 29;15(1):329.
doi: 10.1038/s41398-025-03453-w.

Altered development and network connectivity in a human neuronal model of 15q11.2 deletion-related neurodevelopmental disorders

Affiliations

Altered development and network connectivity in a human neuronal model of 15q11.2 deletion-related neurodevelopmental disorders

Christa W Habela et al. Transl Psychiatry. .

Abstract

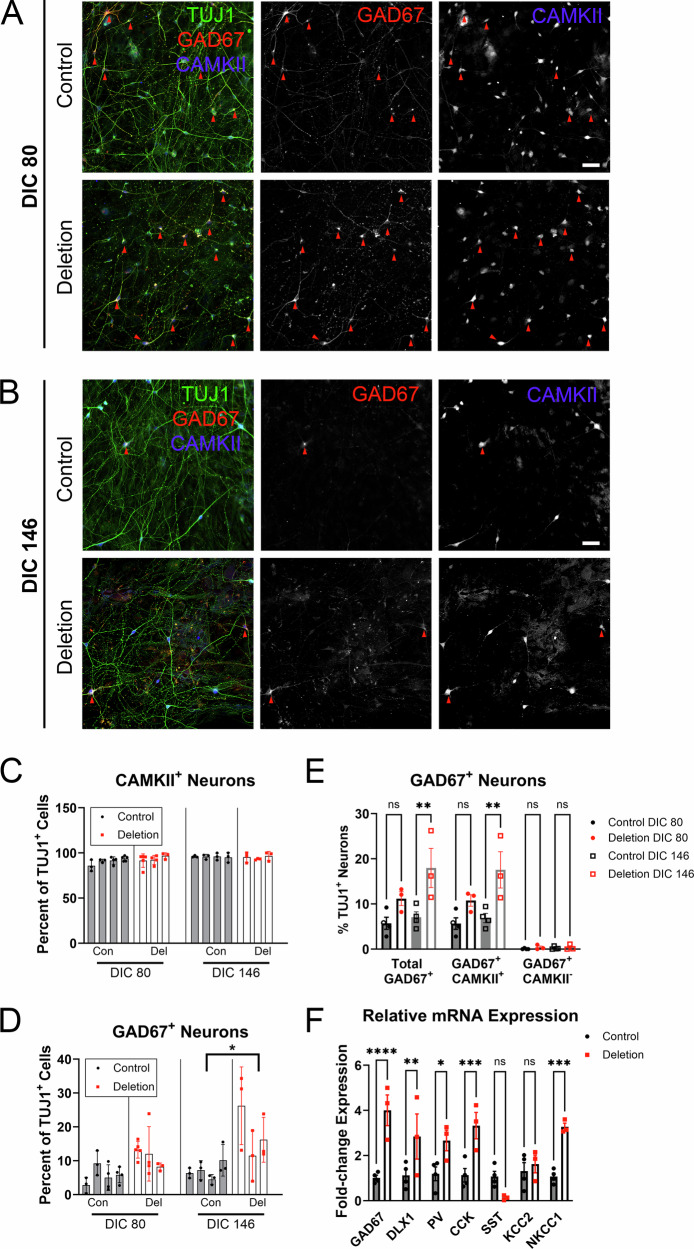
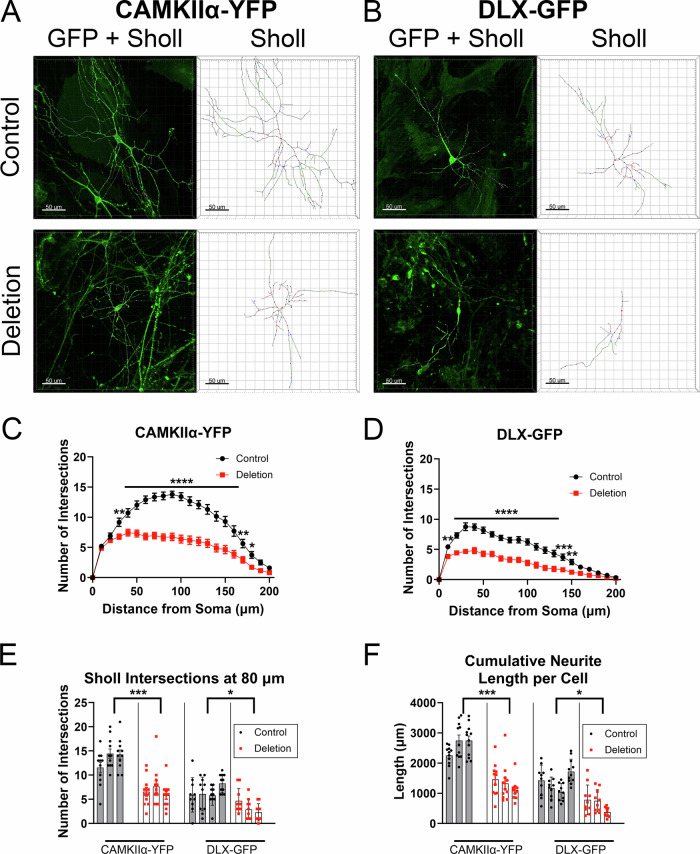
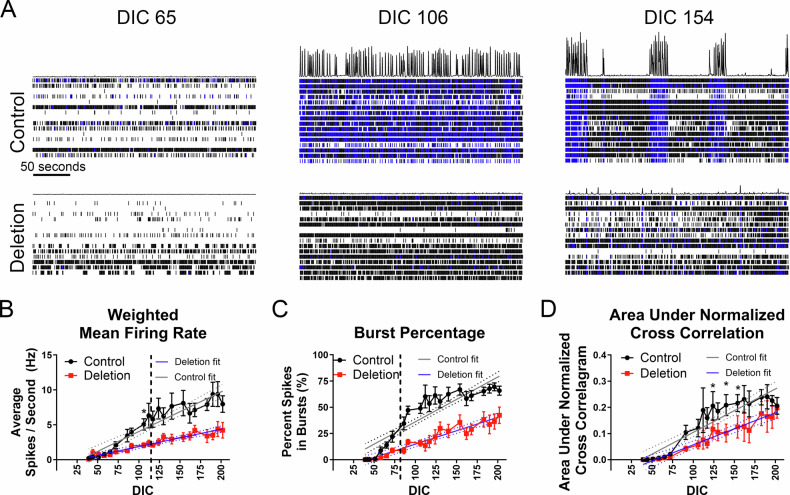
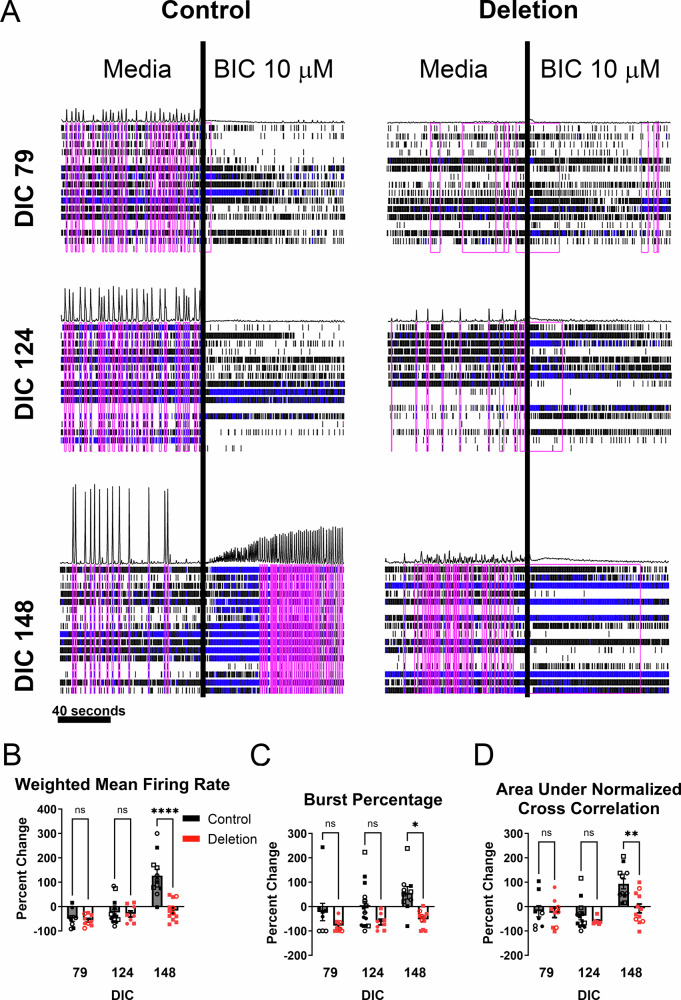
The chromosome 15q11.2 locus is deleted in 1.5% of patients with genetic epilepsy and confers a risk for intellectual disability and schizophrenia. Individuals with this deletion demonstrate increased cortical thickness, decreased cortical surface area and white matter abnormalities. Human induced pluripotent stem cell (iPSC)-derived neural progenitor cells from 15q11.2 deletion individuals exhibit early adhesion junction and migration abnormalities, but later neuronal development and function have not been fully assessed. Imaging studies indicating altered structure and network connectivity in the anterior brain regions and the cingulum suggest that in addition to alterations in neural progenitor dynamics, there may also be structural and functional changes within discrete networks of neurons. To explore this, we generated human forebrain cortical neurons from iPSCs derived from individuals with or without 15q11.2 deletion and used longitudinal imaging and multielectrode array analysis to evaluate neuronal development over time. 15q11.2 deleted neurons exhibited fewer connections and an increase in inhibitory neurons. Individual neurons had decreased neurite complexity and overall decreased neurite length. These structural changes were associated with a reduction in multiunit action potential generation, bursting and synchronization. The 15q11.2 deleted neurons also demonstrated specific functional deficits in glutamate- and GABA-mediated neuronal network activity and synchronization with a delay in the maturation of the inhibitory response to GABA. These data indicate that deletion of the 15q11.2 region is sufficient to impair the structural and functional maturation of cortical neuron networks, and suggest an in vitro correlate to the pathologic changes in humans with the 15q11.2 deletion.


Conflict of interest statement

Competing interests: The authors declare no competing interests. Ethics and consent to participate: De-identified fibroblast samples and iPSCs were obtained from commercial sources. Informed consent for sample donation was obtained at the Coriell Institute Biorepositories (Camden, New Jersey) and Cedar Sinai (West Hollywood, California) prior to deidentification and material transfer. All methods were performed in accordance with institutional safety and internal review board guidelines.

Figures

Fig. 1
Fig. 1. 15Q11.2 deletion alters network structure.
A, B Representative images of TUJ1+ (green, left merged panel) neurons stained for CAMKII (blue) and GAD67 (red) in control and deletion neurons to identify glutamatergic and GABAergic neurons, respectively, demonstrate deficits in network organization. Images taken on day in culture (DIC) 80 A and DIC 146 B. Red arrows indicate GAD67+ neurons. Scale bar 50 µm. C Quantification of the percent of TUJ1+ neurons expressing CAMKIIα at DIC 80 and 146 presented by donor line with each column representing a donor and each symbol representing an independent culture of that line. D Quantification of the percent of TUJ1+ neurons expressing GAD67 at DIC 80 and 146 presented by donor line as in C. Nested one-way ANOVA P = 0.01 with Sidak’s multiple comparison’s test. E Quantification of the percent of TUJ1+ neurons expressing GAD67 as well as GAD67+ CAMKIIα+ and GAD67+ CAMKIIα- neurons. Each symbol represents the mean of a minimum of three cultures from an individual donor line. Bars are the mean ± standard error of the mean (SEM) of four control and three 15q11.2 deletion lines. Two-way ANOVA with Tukey’s multiple comparison correction. F Reverse transcription quantitative PCR (qRT-PCR) data from DIC 141 cultures using human specific primers for interneuron transcripts and the pan-neuronal NKCC1 and KCC2 transcripts. All transcripts were normalized to the expression of the housekeeping gene, human RPS18 (Ribosomal protein S18), and to the mean of the control conditions. Each symbol represents 4 technical replicates for an individual donor’s line. Each bar represents the mean of 4 control and 3 deletion donor lines. Two-way ANOVA with Tukey’s multiple comparison test. * = P < 0.05, ** = P < 0.01, *** = P < 0.001 and **** = P < 0.0001.
Fig. 2
Fig. 2. 15q11.2 deletion decreases neurite complexity and length but not synaptic density.
A 3D reconstructions of 25X oil immersion confocal images of pAAV-hSyn-EGFP (SYNAPSYN-GFP) expressing representative neurons with corresponding Sholl intersections in control and 15q11.2 deletion neurons at DIC 80 and DIC 146. Panels on the left demonstrate reconstruction of GFP (green) with Sholl intersection overlay (multicolored spheres). Panels on the right demonstrate inverted images with Sholl intersection and neurite skeleton only. Scale bar 50 µm. B Quantification of Sholl analysis of N = 29 control cells from 4 lines and N = 26 deletion cells from 3 lines at DIC 80. Two-way ANOVA P < 0.0001. C Sholl analysis of N = 49 control cells from 4 lines and N = 45 deletion cells from 3 lines at DIC 146. Two-way ANOVA P < 0.0001. D Average Scholl intersections by line at 80 µm from data in B and C. Individual data points are means of 6–12 cells per donor line. Columns represent means ± SEM of n = three to four donor lines. Individual symbols are the mean of a single donor line. Two-way ANOVA P < 0.001. E Data from D presented by donor line. Columns represent mean per line and symbols are individual neurons. F Average total neurite length per cell is decreased in deletion compared to control donor lines. Symbols are average of cells from each donor line. Columns are means of N = 3 or 4 donor lines per condition and timepoint. G Data from F presented per donor line. Column is the mean per line and each symbol is a neuron. Two-way ANOVA P < 0.001. Tukey’s multiple comparisons * = P < 0.05, ** = P < 0.01, *** = P < 0.001, **** = P < 0.0001. H Representative 3D reconstructions of 63X confocal images of control (top) and 15q11.2 deletion (bottom) proximal neurites of SYNAPSIN-GFP (green) expressing neurons at DIC146 immunostained for either glutamatergic (left two columns) or GABAergic (right two columns) synapses. Glutamatergic synapses are identified based on immunostaining for vesicular glutamate transporter 1 (VGLUT1) (red) outside of the neurite and intracellular post synaptic density protein 95 (PSD95) (blue) (left panels). Panels on the right show the neurite mask generated by SYNAPSIN-GFP staining (green). The presynaptic puncta from glutamatergic synapses on to the masked neurons are generated from VGLUT1 staining outside of the mask (red spheres) that are within 1 µm of the PSD95 puncta within the neurite (blue spheres, masked by neurite). GABAergic synapses are identified by immunostaining for presynaptic glutamic acid decarboxylase 65 (GAD65) (red) and post synaptic scaffolding protein GEPHRYN (blue). Panels on the right show the mask generated by GFP staining (green). The presynaptic puncta from GABAergic synapses on to the masked neurons are generated from GAD65 staining outside of the mask and within 1 µm of the GEPHRYN puncta within the neurite. Post synaptic puncta are generated from GEPHRYN staining within the masked region. I Quantification of glutamatergic synapses, defined as pre and post synaptic puncta colocalizing within 1 µm of each other, normalized to the surface area of the masked region to determine density. J Quantification of glutamatergic synapses, defined as pre and post synaptic puncta colocalizing within 1 µm of each other, normalized to the surface area of the masked region to determine density. For I and J, each symbol type represents a different donor line with each symbol representing a neurite from a unique cell. Scale bar 3 µm. Not significant by two-tailed t test.
Fig. 3
Fig. 3. 15q11.2 deletion decreases neurite complexity and length in both glutamatergic and GABAergic neurons.
A, B 3D reconstructions of 25X oil immersion confocal images of pAAV9-CaMKIIa-hChR2(H134R)-EYFP (CAMKIIα-YFP) and pAAV9-mDlx-GFP-Fishell-1 (DLX-GFP) expressing representative neurons with corresponding Sholl intersections in control and 15q11.2 deletion neurons at DIC 141. Panels on the left in A and B demonstrate reconstruction of anti-GFP immunostaining (green) with Sholl intersection overlay (multicolored spheres). Panels on the right demonstrate inverted images with Sholl intersection and neurite skeleton only. Scale bar 50 µm. C Sholl analysis of CAMKIIα-YFP+ neurites from N = 33 control cells from 3 lines and N = 33 deletion cells from 3 lines ad DIC 141. Two-way ANOVA P < 0.0001. D Sholl analysis of DLX-GFP+ neurites from N = 41 control cells from 4 donor lines and N = 30 deletion cells from 3 donor lines at DIC 141. Two-way ANOVA P < 0.0001. Tukey’s multiple comparisons test * = P < 0.05, ** = P < 0.01, *** = P < 0.001, **** = P < 0.0001. E Scholl intersections by line at 80 µm from data in C and D. Columns represent mean per line and symbols are individual neurons. Nested one-way ANOVA P < 0.0001. F Average total neurite length per cell is decreased in deletion compared to control donor lines. Column is the mean per line and each symbol is total neurite length for a single neuron. Nested one-way ANOVA P < 0.0001. Sidak’s multiple comparisons test * = P < 0.05 and *** = P < 0.001.
Fig. 4
Fig. 4. 15q11.2 deletion decreases firing rate and bursting and delays synchrony in culture networks.
A Raster plots of spikes determined from voltage recordings from 16 electrodes from representative single wells of control (top) and 15q11.2 deletion (bottom) cultures at DIC 65, 106 and 154. Each row is data from a single electrode. Single spikes for a given electrode are represented by black vertical marks. Blue vertical lines are spikes on a single electrode meeting criterion for an electrode burst (5 spikes occurring within 100 ms). Black tracing at the top of each panel represents relative spikes per time per second across the entire well. Time scale bar is 50 s. Analysis of four control and three 15q11.2 deletion lines over at least 3 independent differentiations for B weighted mean firing rate (Two-way ANOVA P < 0.0001), C percent of spikes that occur in bursts (burst percentage) (Two-way ANOVA P < 0.0001), Tukey’s multiple comparison test and D area under normalized cross correlogram (AUNCC) as a quantification of synchronization (TwoWay ANOVA P < 0.0001). Mean values ± SEM are indicated by symbols. Linear regressions (solid lines) with 95% confidence intervals (dashed lines) are in grey and blue. Two-way ANOVA P < 0.0001. Tukey’s multiple comparisons * = P < 0.05. For B and C, Tukey’s multiple comparison’s testing indicates significance from P < 0.01 to P < 0.0001  for all data points to right of the vertical dashed line.
Fig. 5
Fig. 5. 15q11.2 deletion results in delayed glutamatergic influence on the network.
A Raster plots of spikes determined from voltage recordings from 16 electrodes from representative single wells of control (left) and 15q11.2 deletion (right) cultures. Each row is data from a single electrode. Single spikes for a given electrode are represented by black vertical marks. Blue vertical lines are spikes on a single electrode, meeting criteria for an electrode burst - 5 spikes occurring within 100 ms. Black tracing at the top of each panel represents spikes per time per second across the entire well. Pink boxes are network bursts. Time scale bar is 40 s. Black vertical line demarcates time of acute CNQX application. Quantification of CNQX mediated effects on B weighted mean firing rate (WMFR), C burst percentage and D synchronization in control and deletion cultures at DIC 100, 138 and 210. Each data point is the mean activity across 16 electrodes for a single well. Individual symbols are independent cultures with the type of symbol indicating a unique donor. Columns are the mean ± SEM of all cultures with 4 control and 3 deletion cultures represented. Two-way ANOVA P < 0.0001. Tukey’s multiple comparisons * = P < 0.05, ** = P < 0.01, *** = P < 0.001.
Fig. 6
Fig. 6. 15q11.2 deletion delays the maturation of synaptic GABA responses.
A Example raster plots demonstrating acute GABA receptor blockade with application of bicuculline. Raster plots of spikes determined from voltage recordings from 16 electrodes from representative single wells of control (left) and 15q11.2 deletion (right) cultures. Each row is data from a single electrode. Single spikes for a given electrode are represented by black vertical marks. Blue vertical lines are spikes on a single electrode meeting criterion for an electrode burst - 5 spikes occurring within 100 ms. Black tracing at the top of each panel represents spikes per time per second across the entire well. Pink boxes are network bursts. Time scale bar is 40 s. Black vertical line demarcates time of acute bicuculline application. Quantification of bicuculline mediated effects on B weighted mean firing rate (WMFR), C burst percentage and D synchronization in control and deletion cultures. Each data point is the mean activity across 16 electrodes for a single well. Individual symbols are independent cultures with the type of symbol indicating a unique donor. Columns are the mean ± SEM of all cultures with 4 control and 2–3 deletion cultures represented. Two-way ANOVA. Tukey’s multiple comparisons * = P < 0.05, ** = P < 0.01, and **** = P < 0.0001.

Update of

References

    1. Cooper GM, Coe BP, Girirajan S, Rosenfeld JA, Vu TH, Baker C, et al. A copy number variation morbidity map of developmental delay. Nat Genet. 2011;43:838–46. 10.1038/ng.909 - PMC - PubMed
    1. Caseras X, Kirov G, Kendall KM, Rees E, Legge SE, Bracher-Smith M, et al. Effects of genomic copy number variants penetrant for schizophrenia on cortical thickness and surface area in healthy individuals: analysis of the UK biobank. Br J Psychiatry. 2021;218:104–11. 10.1192/bjp.2020.139 - PMC - PubMed
    1. Mefford HC, Yendle SC, Hsu C, Cook J, Geraghty E, McMahon JM, et al. Rare copy number variants are an important cause of epileptic encephalopathies. Ann Neurol. 2011;70:974–85. 10.1002/ana.22645 - PMC - PubMed
    1. Coe BP, Witherspoon K, Rosenfeld JA, van Bon BWM, Vulto-van Silfhout AT, Bosco P, et al. Refining analyses of copy number variation identifies specific genes associated with developmental delay. Nat Genet. 2014;46:1063–71. 10.1038/ng.3092 - PMC - PubMed
    1. Cox D, Butler M. The 15q11.2 BP1-BP2 microdeletion syndrome: a review. Int J Mol Sci. 2015;16:4068–82. 10.3390/ijms16024068 - PMC - PubMed

LinkOut - more resources