. 2025 Aug 29;11(1):416.
doi: 10.1038/s41420-025-02708-1.

Reduction of lymphotoxin beta receptor induces cellular senescence via the MDMX-p53 pathway

Affiliations

Reduction of lymphotoxin beta receptor induces cellular senescence via the MDMX-p53 pathway

So Young Kim et al. Cell Death Discov. .

Abstract

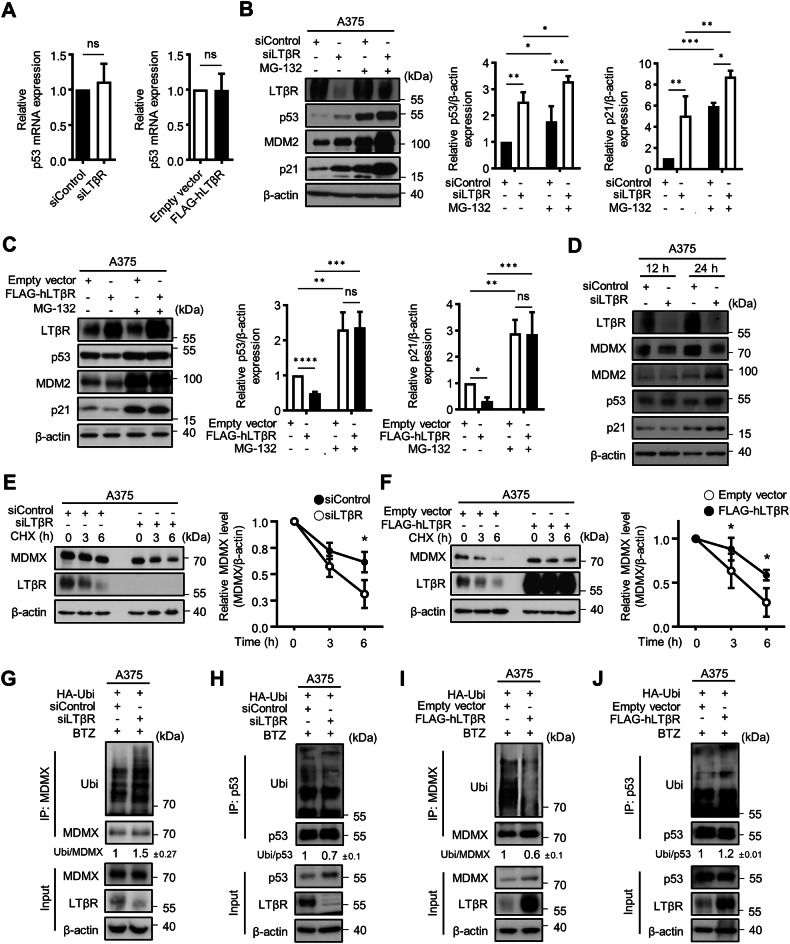
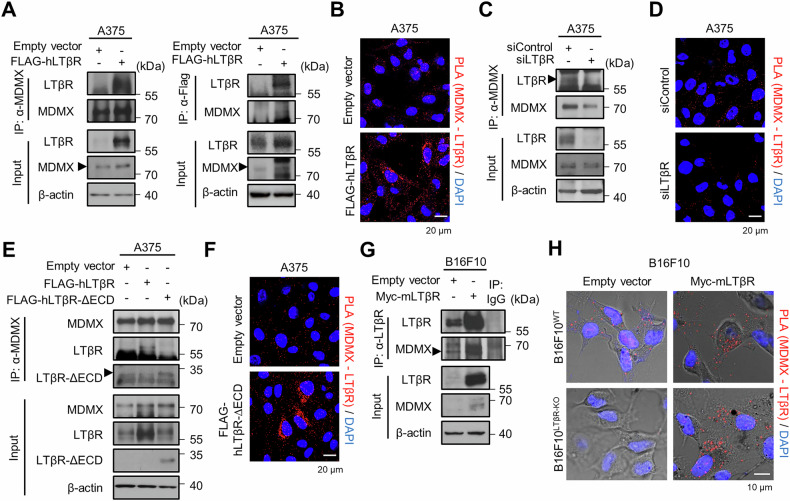
The lymphotoxin β receptor (LTβR), a key activator of non-canonical NF-κB signaling, is expressed in various cells, including cancer cells. Although high expression of LTβR has been associated with poor patient prognosis and drug resistance, conflicting evidence suggested that LTβR induces apoptosis. To investigate the functional role of LTβR in tumors, we performed LTβR knockdown in cancer cells. We found that LTβR knockdown induced senescence phenomena such as reduced cell number; increased cell size; increased SA-β-Gal activity; and upregulated p53, MDM2 and p21 expression. Moreover, LTβR knockdown induced p21-mediated senescence in p53 WT cancer cells, but not in p53 mutant cancer cells. The level of p53 is regulated by MDM2 and MDMX; MDMX enhances MDM2 activity but is also subject to MDM2-mediated degradation in the nucleus. We found that the intracellular domain of LTβR bound to MDMX thereby inhibited its nuclear translocation, which in turn reduced MDMX ubiquitination and consequently promoted p53 ubiquitination. Additionally, tumors derived from B16F10LTβR-KO cells in WT mice exhibited significantly reduced growth compared to those derived from B16F10WT cells. These results demonstrate that LTβR regulates p53 protein levels by modulating MDMX stability and localization, resulting in p53-mediated cellular senescence. LTβR regulates p53-mediated senescence by inhibiting MDMX nuclear translocation and degradation. LTβR interacts with MDMX in the cytoplasm, preventing its nuclear translocation and degradation under normal conditions (dotted arrows). When LTβR is depleted, MDMX is translocated into the nucleus by MDM2, and undergoes degradation (solid arrows). This reduces p53 degradation and consequently activates p53, leading to p21 transcription and the induction of cellular senescence. Treatment with doxorubicin (Dox) or nutlin-3a further enhances p53-mediated transcriptional activation of p21, and their combination with LTβR depletion exerts an additive effect in promoting cellular senescence.


Conflict of interest statement

Competing interests: The authors declare no competing interests. Ethics approval: All animal procedures were approved by the Institutional Animal Care and Use Committee (IACUC) of Yonsei University College of Medicine (IACUC no. 2023-0146) and were performed in accordance with the Guide for the Care and Use of Laboratory Animals (National Research Council).

Figures

None
LTβR regulates p53-mediated senescence by inhibiting MDMX nuclear translocation and degradation. LTβR interacts with MDMX in the cytoplasm, preventing its nuclear translocation and degradation under normal conditions (dotted arrows). When LTβR is depleted, MDMX is translocated into the nucleus by MDM2, and undergoes degradation (solid arrows). This reduces p53 degradation and consequently activates p53, leading to p21 transcription and the induction of cellular senescence. Treatment with doxorubicin (Dox) or nutlin-3a further enhances p53-mediated transcriptional activation of p21, and their combination with LTβR depletion exerts an additive effect in promoting cellular senescence.
Fig. 1
Fig. 1. Depletion of LTβR induces p53-mediated senescence.
A, B A375 cells were transfected with 100 nM of siControl (control siRNA) or siLTβR (LTβR siRNA), followed by 100 ng/ml Dox treatment for 48 h. Morphological changes, relative cell number (A), and confocal images of a senescence green probe (B) were analyzed. C, D B16F10WT (LTβR WT), and B16F10LTβR-KO (LTβR knockout) cells were treated with 100 ng/ml Dox for 48 h. Morphological changes and relative cell number (C), and confocal images of senescence green probe (D) were examined. E, F Western blot images of A375 and B16F10 cells showing the indicated proteins in LTβR-depleted cells. S.E. short exposure, L.E. long exposure. Band intensities of p53, p21 and MDM2 were measured using ImageJ and normalized to β-actin. Results are presented as the mean ± SD from three separate experiments. B, D Fluorescence intensities for relative senescence green probe were quantified by ImageJ, and data are shown as mean ± SD from three independent experiments (n = 3). *p < 0.05, **p < 0.01, ***p < 0.001, ****p < 0.0001, using Fisher’s LSD post hoc test. n.s not significant.
Fig. 2
Fig. 2. LTβR inhibits senescence.
AD A375 and B16F10 cells were transfected with LTβR plasmid followed by 100 ng/ml Dox treatment for 48 h. Cells were photographed for analyzing morphological change and relative cell number (A, C), and stained using a senescence green probe (B, D). Relative fluorescence intensity for the senescence green probe was quantified using ImageJ. E, F Western blot images of A375 and B16F10 cells for the indicated proteins are representative of three experiments, and the relative p53, p21, and MDM2 protein levels were measured. Bands were quantified using ImageJ software and normalized to β-actin. Graphical data are represented as mean ± SD from three independent experiments (n = 3). *p < 0.05, **p < 0.01, ***p < 0.001, ****p < 0.0001, using Fisher’s LSD post hoc test. n.s, not significant.
Fig. 3
Fig. 3. LTβR modulates p53 and MDMX protein expression.
A Relative p53 mRNA levels in A375 cells with LTβR knockdown or LTβR-overexpressing cells determined by real-time PCR. B, C Western blot analysis of p53 and p21 protein levels in A375 cells after 20 μM of MG-132 treatment for 4 h, following siRNA (B) or LTβR plasmid (C) transfection. p53 and p21 relative band intensities were quantified using ImageJ software, and normalized to β-actin. D Western blot analysis of MDMX, p53, MDM2, and p21 protein expression in A375 cells after 12 h or 24 h of siControl or siLTβR transfection. E, F Cycloheximide (CHX, 100 μg/ml) chase assays were conducted to determine MDMX protein stability in LTβR-overexpressing and LTβR knockdown cells for the indicated time and quantified using ImageJ. GJ A375 cells were treated with 80 nM of BTZ for 4 h, and whole cell lysate was subjected to immunoprecipitation to confirm MDMX ubiquitination and p53 ubiquitination. Relative expression levels of ubiquitinated MDMX and p53 were measured using ImageJ software, normalized, and presented as mean ± SD from three independent experiments. Graphical data are presented as means ± SD from three independent experiments (n = 3). n.s not significant, using an unpaired Student’s t-test (A). *p < 0.05, **p < 0.01, ***p < 0.001, ****p < 0.0001, using Fisher’s LSD post hoc test (B, C) or Šidák’s multiple comparison test (E, F). n.s not significant.
Fig. 4
Fig. 4. LTβR interacts with MDMX in the cytosol.
A, B A375 cells were transfected with LTβR plasmid for 48 h. LTβR-overexpressing cells were subjected to immunoprecipitation with LTβR and MDMX, and PLA was performed using MDMX, Flag, and LTβR antibodies. C, D A375 cells were transfected with 100 nM of siControl or siLTβR for 48 h, and subjected to immunoprecipitation and PLA using LTβR and MDMX antibodies. E, F Immunoprecipitation and PLA of extracellular domain (ECD)-deleted LTβR-transfected cells were performed using MDMX and LTβR antibodies. G Immunoprecipitation of LTβR and immunoblotting using MDMX antibody validated the interaction in LTβR-overexpressing B16F10 cells. H B16F10WT and B16F10LTβR-KO cells were transfected with LTβR plasmid, and PLA was performed to determine the location of interaction between LTβR and MDMX.
Fig. 5
Fig. 5. LTβR inhibits MDMX nuclear translocation.
A, B A375 cells were treated with 80 nM BTZ (bortezomib) for 4 h after siRNA or plasmid transfection. Nuclear and cytosol fractions were isolated, followed by western blotting. GAPDH (cytosol) and Lamin B1 (nuclear) were used as loading controls. C, D Confocal microscopy was used to assess MDMX localization. Nuclear MDMX band and fluorescence intensities were measured relative to cytosolic MDMX using ImageJ. E, F PLA was performed to confirm the relative interaction between MDM2 and MDMX in LTβR knockdown cells or LTβR-overexpressing cells. Relative co-localization signals of MDM2 and MDMX (shown in graph) were quantified using ImageJ. Graphical data are presented as means ± SD (n = 3) from three independent experiments. *p < 0.05, **p < 0.01, ****p < 0.0001, using an unpaired Student’s t-test.
Fig. 6
Fig. 6. Depletion of LTβR inhibits tumor growth.
Tumors were established by the subcutaneously injecting of B16F10WT and B16F10LTβR-KO cells into mice. On day 9 after implantation, mice were administered with 4 mg Dox per kg of mouse body weight. AC Tumors were harvested on day 16, photographed, and their weight and volume were measured (n = 6). D Western blotting of tumor cell lysates for indicated proteins. E Paraffin-embedded tissue sections were stained for p21, and relative expression levels were measured using ImageJ. F Cryosections of tumor tissue were subjected to SA-β-Gal staining, and relative SA-β-Gal activity was measured using ImageJ. Brown pigments in the histological sections represent melanin deposits. Hematoxylin was used for counterstaining. Graphical data are presented as means ± SD (n = 3). *p < 0.05, **p < 0.01, ***p < 0.001, ****p < 0.0001, using Fisher’s LSD post hoc test. n.s not significant.
Fig. 7
Fig. 7. LTβR depletion synergistically enhances inhibition of tumor growth with nutlin-3a.
AC Tumors were generated by implantating B16F10WT and B16F10LTβR-KO cells into mice. On day 9 after implantation, mice were injected with 20 mg nutlin-3a per kg of mouse body weight. After 7 days, tumors were collected, photographed, and their weight and volume were measured (n = 4). D Western blot of tumor cell lysates for indicated proteins. E Paraffin-embedded tissue sections were stained for p21, and relative expression was measured. F Cryosections of tumor tissue were stained with SA-β-Gal to assess senescence activity. Brown pigments in the histological section indicate melanin deposits. Hematoxylin was used for counterstaining. Graphical data are presented as means ± SD (n = 3). *p < 0.05, **p < 0.01, ***p < 0.001, ****p < 0.0001, using Fisher’s LSD post hoc test. n.s not significant.

References

    1. Mikami Y, Matsuzaki H, Horie M, Noguchi S, Jo T, Narumoto O, et al. Lymphotoxin β receptor signaling induces IL-8 production in human bronchial epithelial cells. PLoS ONE. 2014;9:e114791. - PMC - PubMed
    1. Shou YJ, Koroleva E, Spencer CMM, Shein SAA, Korchagina AAA, Yusoof KAA, et al. Redefining the role of lymphotoxin beta receptor in the maintenance of lymphoid organs and immune cell homeostasis in adulthood. Front Immunol. 2021;12:712632. - PMC - PubMed
    1. Tamada K, Shimozaki K, Chapoval AI, Zhai Y, Su J, Chen SF, et al. LIGHT, a TNF-like molecule, costimulates T cell proliferation and is required for dendritic cell-mediated allogeneic T cell response. J Immunol. 2000;164:4105–10. - PubMed
    1. Chin RK, Zhu M, Christiansen PA, Liu W, Ware C, Peltonen L, et al. Lymphotoxin pathway-directed, autoimmune regulator-independent central tolerance to arthritogenic collagen. J Immunol. 2006;177:290–7. - PubMed
    1. Wimmer N, Huber B, Barabas N, Röhrl J, Pfeffer K, Hehlgans T. Lymphotoxin β receptor activation on macrophages induces cross-tolerance to TLR4 and TLR9 ligands. J Immunol. 2012;188:3426–33. - PubMed

LinkOut - more resources