. 2025 Aug 29;16(1):8083.
doi: 10.1038/s41467-025-63393-3.

Prefoldin complex promotes interferon-stimulated gene expression and is inhibited by rotavirus VP3

Affiliations

Prefoldin complex promotes interferon-stimulated gene expression and is inhibited by rotavirus VP3

Yinxing Zhu et al. Nat Commun. .

Abstract

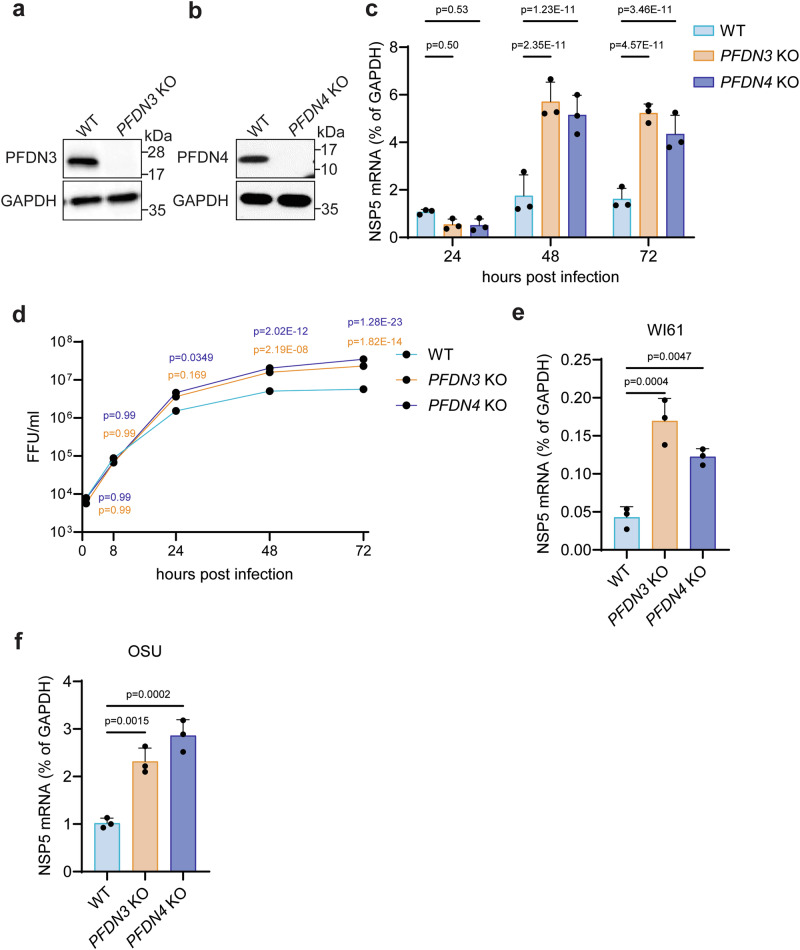
Timely induction of interferons and interferon-stimulated genes (ISGs) is critical for successful host defense against viral infections. VP3 encoded by rotavirus is implicated in interferon antagonism. However, the precise mechanisms remain incompletely understood. By conducting tandem-affinity purification coupled with high-resolution mass spectrometry, we identify the prefoldin complex as the top cellular binding partner of VP3. Rotavirus infection is significantly enhanced in prefoldin subunit knockout cells. Using proteome-wide label-free quantification, we find that prefoldin assists in folding ubiquitin-like-modifier-activating-enzyme-3 (UBA3), both of which positively regulate ISG expression. Through direct and competitive binding, VP3 interferes with the chaperone activity of prefoldin, leading to unstable UBA3, reduces IRF9, and suppresses ISG transcription. Our findings report a novel function of a prefoldin-UBA3-IRF9-ISG axis in antiviral immunity and uncover new aspects of virus-host interactions that could be exploited for broad-spectrum antiviral therapeutic development.


Conflict of interest statement

Competing interests: The authors declare no competing interests.

Figures

Fig. 1
Fig. 1. RV VP3 interacts with the PFDN complex.
a A protein-protein interactome of the bait protein VP3 (blue node) and high-confidence host interaction partners (purple and gray nodes). Solid green lines represent novel interactions identified in this study. The widths of the green lines correspond to the number of spectral peptides identified in the IP-MS experiment. Dotted black lines indicate curated protein-protein interactions in public proteomics databases. b Lysates of HEK293 cells co-transfected with GFP-VP3 and PFDN1-6-Myc were subject to immunoprecipitation using α-GFP antibody and probed with α-Myc antibody. c Lysates of doxycycline-induced HEK293 cells that expressed GFP, GFP-VP2, and GFP-VP3 were subject to immunoprecipitation using α-GFP antibody and probed with α-PFDN3 antibody. d A549 cells were transfected with the indicated plasmids for 24 h, followed by infection with RV (RRV strain) at an MOI of 1 for 12 h. Co-immunoprecipitation was performed, and the interaction between VP3 and PFDN3 was analyzed by western blot. e A His-pulldown assay of VP3 and human PFDN3. His-VP3 and His-CDPK1 were incubated with Ni2+ beads and then with BSA or PFDN3. Flow-through and His-tagged proteins in the eluates were detected by Coomassie blue (CBB) staining and examined by western blotting using a rabbit anti-PFDN3 antibody. f BLI sensorgrams obtained using biosensor loaded with His-tagged CDPK1 or VP3 (10 nM) (load) and incubated with 50 µM PFDN3 protein (association). The dissociation is shown on the right. The binding of PFDN3 to VP3 or CDPK1 is shown in red and black, respectively. For all figures, experiments were repeated at least three times. Experiments (be) were repeated at least two times.
Fig. 2
Fig. 2. CRISPR knockout of PFDN promotes RV replication.
a Western blot detection of PFDN3 in knockout (PFDN3 KO) and wild-type (WT) HEK293 cells. b Western blot detection of PFDN4 in knockout (PFDN4 KO) and WT HEK293 cells. c WT, PFDN3 KO, and PFDN4 KO HEK293 cells were infected with RV (UK strain, MOI  =  5), and viral NSP5 mRNA level was measured at 24, 48, and 72 hpi by RT-qPCR. Data represents the average of three experiments; error bars indicate SEM (two-way ANOVA with Tukey’s multiple comparisons test). d WT, PFDN3 KO, and PFDN4 KO HEK293 cells were infected with RV (UK strain, MOI  =  5), and viral titers were measured at 1, 8, 24, 48, and 72 hpi by an FFU assay. Data represents the average of three experiments; error bars indicate SEM (two-way ANOVA with Dunnett’s multiple comparisons test). e WT, PFDN3 KO, and PFDN4 KO HEK293 cells were infected with RV (WI61 strain, MOI  =  5), and viral NSP5 mRNA level was measured at 72 hpi by an FFU assay. Data represents the average of three experiments; error bars indicate SEM (one-way ANOVA with Dunnett’s multiple comparisons test). f WT, PFDN3 KO, and PFDN4 KO HEK293 cells were infected with RV (OSU strain, MOI  =  5), and viral NSP5 mRNA level was measured at 72 hpi by an FFU assay. Data represents the average of three experiments; error bars indicate SEM (one-way ANOVA with Dunnett’s multiple comparisons test).
Fig. 3
Fig. 3. PFDN mediates IFN-β- and RV-induced ISG production.
a HEK293 cells (WT, PFDN4 KO, and PFDN4 rescue) were stimulated with IFN-β (500 U/ml) for 24 h. The PFDN4 rescue cells were PFDN4 KO cells transduced with Flag-tagged PFDN4 (single clone). A heatmap summarizes the transcript levels of MYC, ISGs (IFITM1, IFITM2, IFITM3, MX1, OAS1, OAS2, and OAS3), IL11, and GAPDH from RNA-sequencing data. The colors represent the Log10 (fold change) in gene counts identified in the RNA-sequencing experiments. b WT, PFDN3 KO, and PFDN4 KO cells were stimulated with IFN-β (500 U/ml), and ISGs (IFITM1 and MX1) mRNA level was measured at 24 hpi by RT-qPCR (left and middle panel). WT, PFDN3 KO, PFDN4 KO, and PFDN4 rescue cells were stimulated with IFN-β (500 U/ml), and the OAS3 mRNA level was measured at 24 hpi by RT-qPCR (right panel). Data represents the average of three experiments; error bars indicate SEM (two-way ANOVA with Dunnett’s multiple comparisons test). c WT, PFDN3 KO, PFDN4 KO HEK293 cells were transduced with vector or PFDN3-Flag or PFDN4-Flag plasmid for 24 h and stimulated with IFN-β (500 U/ml) for another 24 h. Total cell lysates were harvested and examined by western blot with indicated antibodies. d WT, PFDN3 KO, and PFDN4 KO HEK293 cells were infected with or without RV (RRV strain) at an MOI of 5 for 24 h. MX1 mRNA level was measured at 24 hpi by RT-qPCR, which was normalized to GAPDH. Data represents the average of three experiments; error bars indicate SEM (two-way ANOVA with Šídák’s multiple comparisons test). For all figures, experiments were repeated at least three times.
Fig. 4
Fig. 4. UBA3 is the substrate of PFDN and activates ISG production.
a Volcano plot of mass spectrometry data from WT and PFDN3 KO cells. Proteins downregulated in both PFDN3 KO and PFDN4 KO cells were shown in blue dots. Statistically significant proteins were identified using a two-sided t test with a permutation-based FDR set at 0.05. b Volcano plot of mass spectrometry data from WT, and PFDN4 KO cells. Proteins downregulated in both PFDN3 KO and PFDN4 KO cells were shown in blue dots. Statistically significant proteins were identified using a two-sided t test with a permutation-based FDR set at 0.05. c HEK293 cells were treated with increasing concentrations of MLN4924 (0, 0.1 μM, 1 μM, and 10 μM) for 24 h and stimulated with or without IFN-β (500 U/ml) for another 24 h. MX1 mRNA was measured by RT-qPCR. Data represents the average of three experiments; error bars indicate SEM (one-way ANOVA with Dunnett’s multiple comparisons test). d WT, PFDN3 KO, and PFDN4 KO HEK293 cell lysates were harvested and examined by western blot with the indicated antibodies. e PFDN4 KO HEK293 cells were transfected with PFDN1-6-Myc plasmids for 24 h. Cell lysates were subject to immunoprecipitation using α-Myc antibody and probed for α-UBA3 antibody. PFDN3 is the top band, and PFDN1-4 and PFDN6 are similar in size, as shown on the bottom. f A His-pulldown assay of PFDN3 and UBA3. His-CDPK1 or His-PFDN3 were incubated with Ni2+ beads and then incubated with GST-UBA3. UBA3 protein in the eluates was detected by western blotting using a mouse anti-UBA3 antibody. g BLI sensorgrams were obtained using a biosensor loaded with His-tagged CDPK1 or PFDN3 (50 nM) (load) and incubated with 50 µM UBA3 protein (association). The dissociation is on the right. The binding of PFDN3 to UBA3 is shown in red. For df, experiments were repeated at least three times.
Fig. 5
Fig. 5. UBA3 activates ISG production.
a Western blot detection of UBA3 and GAPDH in WT and UBA3 KO (sgRNA1, sgRNA2) HEK293 cells. Experiments were repeated two times. b WT, UBA3 KO (sgRNA1, sgRNA2), PFDN4 KO, PFDN4 and UBA3 double KO (sgRNA1, sgRNA2) HEK293 cells were stimulated with IFN-β (500 U/ml) for 24 h. MX1 mRNA level was measured by RT-qPCR. Data represents the average of three experiments; error bars indicate SEM (one-way ANOVA with Dunnett’s multiple comparisons test). c WT, UBA3 KO (sgRNA1, sgRNA2), PFDN4 KO, and PFDN4 and UBA3 double KO (sgRNA1, sgRNA2) HEK293 cells were stimulated with IFN-β (500 U/ml) for 24 h. Cell lysates were analyzed by western blot. d WT, UBA3 KO HEK293 cells were infected with or without RV (RRV strain, MOI of 5) for 24 h. MX1 mRNA level was measured by RT-qPCR. Data represents the average of three experiments; error bars indicate SEM (two-way ANOVA with Tukey’s multiple comparisons test). e WT and UBA3 KO HEK293 cells were treated with or without Ruxo (10 μM) and IFN-β (500U/ml) for 24 h, and then infected with UK (MOI = 5) for 72 h. Virus titers were determined by an FFU assay. Data represents the average of three experiments; error bars indicate SEM (one-way ANOVA with Tukey’s multiple comparisons test). f WT and UBA3 KO HEK293 cells were induced with IFN-β (500 U/ml) for 24 h. IRF9 mRNA level was measured by RT-qPCR. Data represents the average of three experiments; error bars indicate SEM (one-way ANOVA with Tukey’s multiple comparisons test). g WT and UBA3 KO HEK293 cells were treated with DMSO or MLN4924 (1 μM) for 24 h, then induced with IFN-β (500 U/ml) for 24 h. Cell lysates were analyzed by western blot.
Fig. 6
Fig. 6. Amino acids 671D and 677Y within VP3 are crucial for hijacking PFDN and inhibiting the interaction between PFDN and UBA3.
a PFDN4 KO HEK293 cells were transfected with PFDN1-6-Myc plasmids for 24 h and infected with or without RV (RRV strain, MOI of 5) for another 24 h. Cell lysates were subject to immunoprecipitation using α-Myc antibody and probed for α-UBA3 antibody. PFDN3 is the top band, and PFDN1-4 and PFDN6 are similar in size, as shown on the bottom. b Schematic diagram of WT and mutant VP3 proteins with defined domains illustrated in colors. c HEK293 cells were transfected with GFP-tagged VP3 mutants for 48 h. Cell lysates were subject to immunoprecipitation using α-GFP antibody and probed for α-PFDN3 antibody. * represents a non-specific band. d A predicted structure of VP3 and PFDN3 complex by AlphaFold-3 (PFDN3: green, VP3: cyan). The orange area was the region 670-689 that interacts with PFDN3. Surface electrostatic charge includes red, positive charge; blue, negative charge; and white, neutral charge. e HEK293 cells were transfected with indicated plasmids for 48 h. Cell lysates were subject to immunoprecipitation using α-GFP beads and probed for α-PFDN3 antibody. f The PFDN3 protein was incubated with 670-689 peptide. BLI sensorgrams obtained using biosensor loaded with His-tagged VP3 (10 nM) (load) and incubated with whether 50 µM PFDN3 protein or PFDN3-670-689 peptide (association). The dissociation is shown on the right. g Amino acid alignment of VP3 (670-689) between different RV strains. Group A rotavirus (RVA: RRV, simian strain; Wa, human strain; SA11, simian strain; OSU, porcine strain; ETD, murine strain), Group C rotavirus (RVC: Bristol, human strain), Group D rotavirus (RVD: 05v0049, chicken strain). h HEK293 cells were transfected with GFP vector, GFP-VP3, or GFP-VP3-D671A/Y677A plasmids for 48 h. Cell lysates were subject to immunoprecipitation using α-GFP beads and probed for α-PFDN3 antibody. i HT-29 cells were infected with SA11 or SA11-GTase-Flag (MOI = 0.1) for 24 h. Cell lysates were subject to immunoprecipitation using α-Flag antibody and probed with α-PFDN3 antibody. For a, c, e, and hi were repeated at least two times.
Fig. 7
Fig. 7. A working model of PFDN-RV VP3 interactions.
PFDN interacts with UBA3 and ensures its correct folding. UBA3 is essential for ISG production. In RV-infected cells, VP3 protein competes with UBA3 for interaction with PFDN. This competition results in the inhibition of ISG expression, thereby benefiting RV replication. In PFDN deficient cells, UBA3 levels are decreased, leading to inhibited ISG production and increased virus replication. RV with VP3 critical mutations cannot bind PFDN and inhibit UBA3 and thus have reduced infectivity. Image was created using Adobe Illustrator.

Similar articles

References

    1. Leroux, M. R. et al. MtGimC, a novel archaeal chaperone related to the eukaryotic chaperonin cofactor GimC/prefoldin. EMBO J.18, 6730–6743 (1999). - PMC - PubMed
    1. Geissler, S. & Siegers, K. E. Schiebel, A novel protein complex promoting formation of functional alpha- and gamma-tubulin. EMBO J.17, 952–966 (1998). - PMC - PubMed
    1. Martin-Benito, J. et al. Structure of eukaryotic prefoldin and of its complexes with unfolded actin and the cytosolic chaperonin CCT. EMBO J.21, 6377–6386 (2002). - PMC - PubMed
    1. Simons, C. T. et al. Selective contribution of eukaryotic prefoldin subunits to actin and tubulin binding. J. Biol. Chem.279, 4196–4203 (2004). - PubMed
    1. Balchin, D., Milicic, G., Strauss, M., Hayer-Hartl, M. & Hartl, F. U. Pathway of Actin Folding Directed by the Eukaryotic Chaperonin TRiC. Cell174, 1507–1521.e1516 (2018). - PubMed

LinkOut - more resources