. 2025 Aug 29;16(1):8092.
doi: 10.1038/s41467-025-63394-2.

A whole-brain male mouse atlas of long-range inputs to histaminergic neurons

Affiliations

A whole-brain male mouse atlas of long-range inputs to histaminergic neurons

Wenkai Lin et al. Nat Commun. .

Abstract

The precise structural and functional characteristics of input circuits targeting histaminergic neurons remain poorly understood. Here, using a rabies virus retrograde tracing system combined with fluorescence micro-optical sectioning tomography, we construct a 3D monosynaptic long-range input atlas of male mouse histaminergic neurons. We identify that the hypothalamus, thalamus, pallidum, and hippocampus constitute major input sources, exhibiting diverse spatial distribution patterns and neuronal type ratios. Notably, a specific layer distribution pattern and co-projection structures of upstream cortical neurons are well reconstructed at single-cell resolution. As histaminergic system is classically involved in sleep-wake regulation, we demonstrate that the lateral septum (predominantly supplying inhibitory inputs) and the paraventricular nucleus of the thalamus (predominantly supplying excitatory inputs) establish monosynaptic connections, exhibiting distinct functional dynamics and regulatory roles in rapid-eye-movement sleep. Collectively, our study provides a precise long-range input map of mouse histaminergic neurons at mesoscopic scale, laying a solid foundation for future systematic study of histaminergic neural circuits.


Conflict of interest statement

Competing interests: The authors declare no competing interests.

Figures
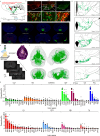
Fig. 1
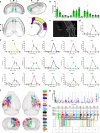
Fig. 1. Whole-brain 3D reconstruction and visualization of long-range monosynaptic inputs to histaminergic neurons.
a Experimental scheme and timeline for labeling long-range monosynaptic inputs to histaminergic neurons in mouse brain. rAAV-EF1α-DIO-mCherry-F2A-TVA-WPRE-hGH polyA, rAAV-EF1α-DIO-oRVG-WPRE-hGH polyA, and RV-ENVA-ΔG-EGFP was injected into TMN of HDC-CreERT2 adult mice. b Representative images of TVA-mcherry and RV-eGFP expression on TMN. This experiment was repeated independently with similar results for three times. c Representative images of coronal sections with several distance from bregma for RV-eGFP expression of mouse brains, with viruses injected into TMN bilaterally. d Drawings of the distribution of starter cells from several coronal sections containing TMN of sample mice. n = 3. e Main steps of data generation, acquisition, and processing in fMOST imaging. Raw data were analyzed by NeuroGPS system and manual correction. f Fluorescent-labeled information visualization of registered RV-eGFP-expression neurons of mouse brain (Top: horizontal and full view; Bottom: coronal and sagittal views). g Fluorescent-labeled neuron proportions of main upstream brain regions of histaminergic neurons from 5 mice. See the details and list of abbreviations in Supplementary Tables 1 and 2. All data are presented as mean ± SEM.
Fig. 2
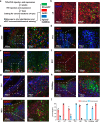
Fig. 2. Layer distribution and co-projection characterization of upstream cortical neurons that target histaminergic neurons.
a Fluorescent-labeled information visualization of registered RV-eGFP-expression cortical neurons of mouse brain (Top: coronal and sagittal views; Bottom: horizontal view and coronal sketch map). b Fluorescent-labeled neuron proportions of all cortical brain regions of histaminergic neurons. n = 5 (derived from different mice). c Representative image of the specific cell body layer distribution manner of one of the tested mice. d, e Fluorescent-labeled neuron proportions of different layers in all cortical brain regions (d) and each cortical brain region (e) of histaminergic neurons. n = 5 (derived from different mice). f Total 150 well reconstructed co-projection structure of upstream cortical neurons in different hemispheres (Top: horizontal view of cortical neurons in left and right hemisphere; Bottom: coronal views of cortical neurons in left and right hemisphere). g, h Co-projection proportion analyze (g) and simplified diagram (h) of well reconstructed neurons in different cortical brain regions. See the list of abbreviations in Supplementary Tables 1 and 2. All data are presented as mean ± SEM.
Fig. 3
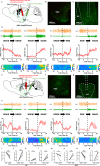
Fig. 3. Excitatory and inhibitory inputs to histaminergic neurons from major upstream brain regions.
a Experimental scheme and timeline for viruses injection and RNAscope in situ hybridization. b–i Representative images of in situ hybridization labeled GABAergic (GAD1) or glutamatergic (Vglut2 or CaMKIIα) markers co-located with RV-eGFP labeled neurons in LS (b), AHY (c), PVT (d), PAG (e), BST (f), CA1 (g), PA/BMAp (h), and MEA (i). j Quantification of eGFP-labeled neurons in major upstream brain regions that are GABAergic (GAD1) or glutamatergic (Vglut2 or CaMKIIα). n = 4. All data are presented as mean ± SEM. All experiments in Fig. 4b–i were repeated independently with similar results for four times. AHY Anterior hypothalamus, BMA Basomedial amygdalar nucleus, BST Bed nuclei of the stria terminalis, CA1 field CA1, LS Lateral septal nucleus, MEA Medial amygdalar nucleus, PA Posterior amygdalar nucleus, PAG Periaqueductal gray, PVT Paraventricular nucleus of the thalamus.
Fig. 4
Fig. 4. Monosynaptic structural and functional connection between LS and PVT neurons with TMN histaminergic neurons.
a Experimental scheme for labeling monosynaptic downstream neurons in TMN from long-range projection of LS GABAergic neurons. rAAV-VGAT1-CRE-EGFP-WPRE-hGH polyA mixed with rAAV-CAG-DIO-mWGA-mCherry was injected into the bilateral LS of HDC; AI47 mouse brain. b Representative images of mWGA-mCherry (monosynaptic input from LS) labeled neurons co-located with GFP (n = 3). c Experimental scheme for labeling monosynaptic downstream neurons in TMN from long-range projection of PVT glutamatergic neurons. rAAV-VGLUT2-CRE-WPRE-hGH polyA mixed with rAAV-CAG-DIO-mWGA-mCherry was injected into the PVT of HDC; AI47 mouse brain. d Representative images of mWGA-mCherry (monosynaptic input from PVT) labeled neurons co-located with GFP (n = 3). e Experimental scheme for viruses injection and electrophysiological test of histaminergic neurons. rAAV-VGAT1-CRE-EGFP-WPRE-hGH polyA mixed with AAV2/9-hSyn-FLEX-ChrimsonR-tdTomato-WPRE-pA was injected into LS of HDC; AI47 mouse brain. 5 ms, 1 Hz pulse of 635 nm red light was performed to evoke IPSCs on histaminergic neurons. f, g Representative images of clamped neuron (f) and all images of pulse laser evoked IPSCs (g), which still present after TTX and 4-AP administration but blocked by GABAA receptor antagonist bicuculline (n = 3). Traces coming from each cell are shown as same color. h Experimental scheme for viruses injection and electrophysiological test of histaminergic neurons. rAAV-VGLUT2-CRE-WPRE-hGH mixed with AAV2/9-hSyn-FLEX-ChrimsonR-tdTomato-WPRE-pA was injected into PVT of HDC; AI47 mouse brain. 5 ms, 1 Hz pulse of 635 nm red light was performed to evoke EPSCs on histaminergic neurons. i, j Representative images of clamped neuron (i) and all images of pulse laser evoked EPSCs (j), which still present after TTX and 4-AP administration but blocked by NMDA receptor antagonist APV and AMPA receptor antagonist CNQX (n = 3). Traces coming from each cell are shown as same color. APV 2-amino-5-phosphonovaleric, CNQX 6-cyano-7-nitroquinoxaline-2,3-dione, LS Lateral septal nucleus, PVT Paraventricular nucleus of the thalamus, TMN Tuberomammillary nucleus, TTX Tetrodotoxin, 4-AP: 4-aminopyridine.
Fig. 5
Fig. 5. Differential Ca2+ dynamics of LS and PVT neurons that target histaminergic neurons in the sleep-wake cycle.
a Experimental scheme for labeling and recording histaminergic neuron-projecting LS neurons. rAAV-EF1α-DIO-mCherry-F2A-TVA mixed with rAAV-EF1α-DIO-N2cG, and CVS-EnvA-ΔG-GCaMP6s were injected into the TMN of HDC-CreERT2 mice. Optical fiber was implanted into mouse brains above the LS for calcium signal recording. b, c Representative images of virus expression in TMN (b) and LS (c). d Representative EEG, EMG, and LS fiber photometry of tested mice. The signals of 5 trails are illustrated in the heatmap (from 2 mice); color scale indicates ΔF/F and warmer colors indicate higher fluorescence signal. Data are presented as mean values ± SEM. e Experimental scheme for labeling and recording histaminergic neuron-projecting PVT neurons. rAAV-EF1α-DIO-mCherry-F2A-TVA mixed with rAAV-EF1α-DIO-N2cG, and CVS-EnvA-ΔG-GCaMP6s were injected into the TMN of HDC-CreERT2 mice. Optical fiber was implanted into mouse brains above the PVT for calcium signal recording. f, g Representative images of virus expression in TMN (f) and PVT (g). h Representative EEG, EMG, and PVT fiber photometry of tested mice. The signals of 5 trails are illustrated in the heatmap (from 2 mice); color scale indicates ΔF/F and warmer colors indicate higher fluorescence signal. Data are presented as mean values ± SEM. i–l Analysis of area under the curve before and after state transitions of wake to NREM sleep (i), NREM sleep to wake (j), NREM sleep to REM sleep (k), and REM sleep to wake (l) in the calcium signal recording of LS. n = 5 (derived from different mice). Statistical analyses were conducted using two-tailed Student’s t-tests without adjustment for multiple comparisons. Significance levels were presented as *p ≤ 0.05, **p ≤ 0.01, ***p ≤ 0.001, or ****p ≤ 0.0001. The exact p-values were as follows: 0.0008 (i), 0.0008 ( j), 0.0020 (k), and 0.0025 (l). m–p Analysis of area under the curve before and after state transitions of wake to NREM sleep (m), NREM sleep to wake (n), NREM sleep to REM sleep (o), and REM sleep to wake (p) in the calcium signal recording of PVT. n = 5 (derived from different mice). Statistical analyses were conducted using two-tailed Student’s t-tests without adjustment for multiple comparisons. Significance levels were presented as *p ≤ 0.05, **p ≤ 0.01, ***p ≤ 0.001, or ****p ≤ 0.0001. The exact p-values were as follows: 0.0460 (m), 0.0004 (n), 0.0007 (o), and 0.0191 (p). LS Lateral septal nucleus, NREM non-rapid eye movement, PVT Paraventricular nucleus of the thalamus, REM rapid eye movement, TMN Tuberomammillary nucleus.
Fig. 6
Fig. 6. The balanced roles of LS- and PVT-TMN circuits in sleep-wake regulation.
a Experimental scheme for labeling input neurons in the LS. rAAV-VGAT1-CRE-EGFP-WPRE-hGH polyA mixed with AAV2/9-hSyn-DIO-hM3D(Gq)-mCherry-WPRE-pA or rAAV-CAG-DIO-mCherry-WPRE-hGH polyA were injected into the bilateral LS of WT mice. Bilateral cannula was implanted into mouse brains above the TMN for CNO infusion. b Representative images of hM3Dq expression in LS (left) and TMN (right). c Experimental scheme for labeling input neurons in the PVT. rAAV-VGLUT2-CRE-WPRE-hGH polyA mixed with AAV2/9-hSyn-DIO-hM3D(Gq)-mCherry-WPRE-pA or rAAV-CAG-DIO-mCherry-WPRE-hGH polyA were injected into the PVT of WT mice. Bilateral cannula was implanted into mouse brains above the TMN for CNO infusion. d Representative images of hM3Dq expression in PVT (left) and TMN (right). e–g Representative continuous EMG, EEG, wake, NREM sleep, and REM sleep scoring data recorded from group of mcherry (e), LS-hM3Dq (f), and PVT-hM3Dq (g) for 24 h (n = 4 for each group). h, i Ratio quantification of wake, NREM sleep, and REM sleep from different groups in 24 h (n = 4 for each group). The exact p-values were as follows: 0.0342 (mCherry-wake vs LS-wake), 0.0039 (mCherry-wake vs PVT-wake), 0.0060 (mCherry-NREM vs LS-NREM), 0.0091 (mCherry-NREM vs PVT-NREM), 0.0011 (mCherry-REM vs LS-REM), and 0.0009 (mCherry-REM vs PVT-REM). j Ratio quantification of NREM and REM sleep from different groups in sleep time. (n = 4 for each group). The exact p-values were as follows: 0.0012 (mCherry-REM vs LS-REM), and 0.0037 (mCherry-REM vs PVT-REM). k Transition number of NREM-REM from different groups in 24 h (n = 4 for each group). The exact p-values were as follows: 0.0011 (mCherry vs LS), 0.0009 (mCherry vs PVT), and <0.0001 (LS vs PVT). l, m Ratio quantification of wake, NREM sleep, and REM sleep from different groups during 12 h (light) of the daytime. The exact p-values were as follows: 0.1455 (mCherry-wake vs LS-wake), 0.0240 (mCherry-wake vs PVT-wake), 0.0476 (mCherry-NREM vs LS-NREM), 0.0384 (mCherry-NREM vs PVT-NREM), 0.0249 (mCherry-REM vs LS-REM), and 0.0090 (mCherry-REM vs PVT-REM). n Ratio quantification of NREM and REM sleep from different groups in daytime sleep. (n = 4 for each group). The exact p-values were as follows: 0.0149 (mCherry-REM vs LS-REM), and 0.0162 (mCherry-REM vs PVT-REM). o Transition number of NREM-REM from different groups during 12 h (light) of the daytime (n = 4 for each group). The exact p-values were as follows: 0.0096 (mCherry vs LS), 0.0298 (mCherry vs PVT), and 0.0006 (LS vs PVT). p, q Ratio quantification of wake, NREM sleep, and REM sleep from different groups during 12 h (dark) of the nighttime. The exact p-values were as follows: 0.0422 (mCherry-NREM vs LS-NREM), 0.3022 (mCherry-NREM vs PVT-NREM), 0.0003 (mCherry-REM vs LS-REM), and 0.0608 (mCherry-REM vs PVT-REM). r Ratio quantification of NREM and REM sleep from different groups in nighttime sleep. (n = 4 for each group). The exact p-values were as follows: <0.0001 (mCherry-REM vs LS-REM), and 0.0398 (mCherry-REM vs PVT-REM). s Transition number of NREM-REM from different groups during 12 h (light) of the nighttime (n = 4 for each group). The exact p-values were as follows: 0.0031 (mCherry vs LS), and 0.0004 (LS vs PVT). All data are presented as mean ± SEM. Statistical analyses were conducted using two-tailed Student’s t-tests without adjustment for multiple comparisons. Significance levels were presented as *p ≤ 0.05, **p ≤ 0.01, ***p ≤ 0.001, or ****p ≤ 0.0001. LS Lateral septal nucleus, NREM non-rapid eye movement, PVT Paraventricular nucleus of the thalamus, REM rapid eye movement, TMN Tuberomammillary nucleus.

Similar articles

References

    1. Yoshikawa, T., Nakamura, T. & Yanai, K. Histaminergic neurons in the tuberomammillary nucleus as a control centre for wakefulness. Br. J. Pharmacol. 10.1111/bph.15220 (2020). - PubMed
    1. Xu, L., Lin, W., Zheng, Y., Wang, Y. & Chen, Z. The diverse network of brain histamine in feeding: dissect its functions in a circuit-specific way. Curr. Neuropharmacol.10.2174/1570159X21666221117153755 (2022). - PMC - PubMed
    1. de Almeida, M. A. & Izquierdo, I. Memory facilitation by histamine. Arch. Int. Pharmacodyn. Ther.283, 193–198 (1986). - PubMed
    1. Arumuham, A. et al. The histamine system and cognitive function: an in vivo H3 receptor PET imaging study in healthy volunteers and patients with schizophrenia. J. Psychopharmacol.37, 1011–1022 (2023). - PMC - PubMed
    1. Inoue, I. et al. Impaired locomotor activity and exploratory behavior in mice lacking histamine H1 receptors. Proc. Natl. Acad. Sci. USA93, 13316–13320 (1996). - PMC - PubMed

LinkOut - more resources