Comparative Study
. 2025 Aug 29;15(1):31838.
doi: 10.1038/s41598-025-13722-9.

Comparative effects of focused ultrasound and microbubbles on healthy and tumor bearing rat spinal cord

Affiliations
Comparative Study

Comparative effects of focused ultrasound and microbubbles on healthy and tumor bearing rat spinal cord

Mahsa Mokhlesabadi et al. Sci Rep. .

Abstract

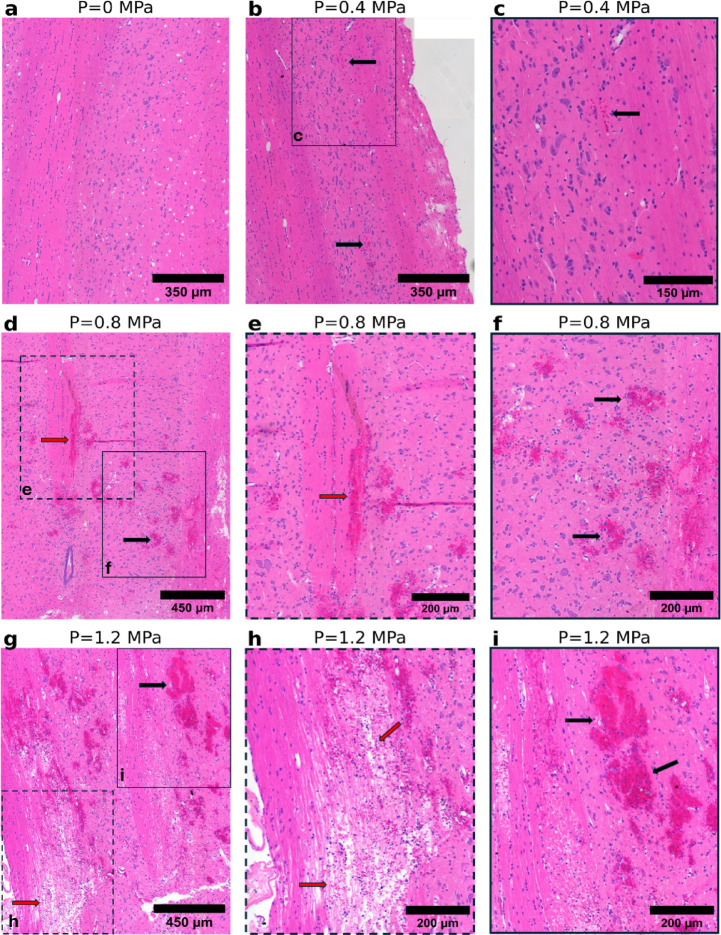
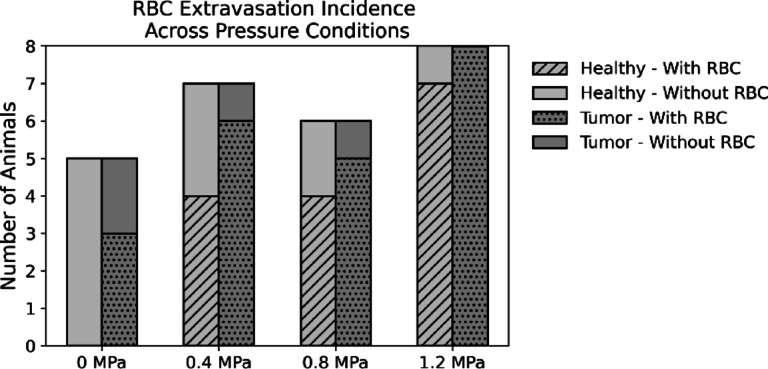
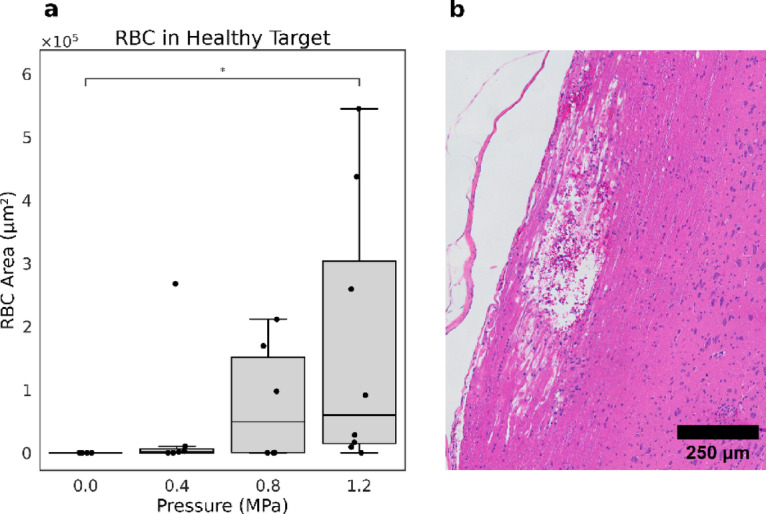
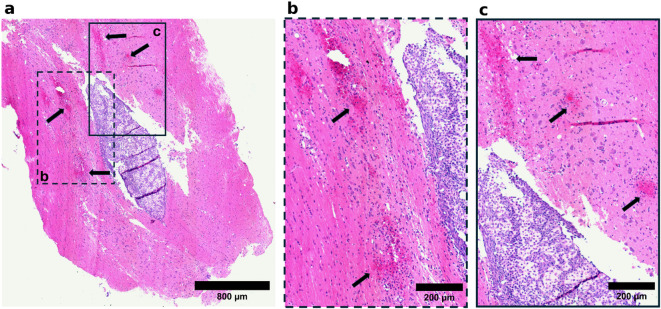
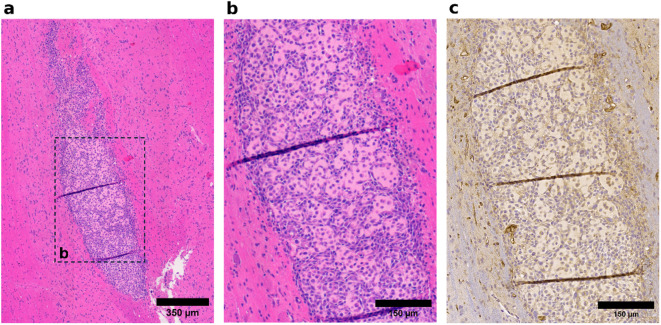
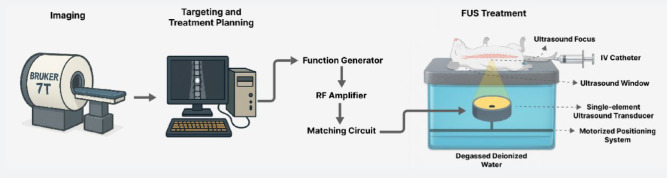
This study examined the differential sensitivity of intramedullary spinal cord tumors (IMSCTs) and healthy tissue to focused ultrasound (FUS) and microbubbles in a rat model of IMSCT. F98 glioma cells were injected into spinal cords of F344 rats. FUS (580 kHz, 10 ms bursts, 1 Hz pulse repetition frequency, 40 s) was delivered to tumor and adjacent healthy tissue at varying pressures (0-1.2 MPa) following intravenous injection of microbubbles (1.00 ± 0.85 µm; 2.4 × 10⁷ microbubbles/100 g). Tissues were collected 24 h post-treatment for histological analysis. Healthy tissue exhibited pressure-dependent damage, including significant differences in red blood cell (RBC) extravasation between 0 and 1.2 MPa conditions (0 ± 0 vs 1.73 × 10⁵ ± 2.15 × 10⁵, p = 0.015), hemorrhagic pools, and tissue disintegration. Conversely, the presence of histopathological features in tumors, regardless of pressure, and no significant differences in RBC extravasation areas between exposure conditions suggests no treatment-induced damage at the tested exposures. These findings indicate F98 gliomas are less sensitive to FUS and microbubbles than healthy spinal cord, likely due to reduced vascularity (p < 0.00001 compared to grey matter, p < 0.05 compared to white matter). This finding indicates alternative strategies (e.g. nanodroplets or molecularly-targeted bubbles) must be explored for effectively treating CNS tumors with low vascularity.

Keywords: Anti-vascular therapy; Focused ultrasound; Glioma; Microbubble; Spinal cord tumor; Tumor vasculature.


Conflict of interest statement

Declarations. Competing interests: M.A.O. holds industry partnered funding (Ontario Research Fund) with FUS Instruments as an industry partner. The other authors declare no competing interests.

Figures

Fig. 1
Fig. 1
Representative H&E-stained histological images of healthy tissue subjected to varying pressure conditions. (a) No structural changes. (b) Minimal RBC extravasation (black arrow). (c) Higher magnification of the region outlined by the solid box in (b); a limited number of RBCs are present. (d) A marked increase in RBC extravasation (black arrow) and appearance of hemorrhagic pools (red arrow). (e) Higher magnification of the region outlined by the dashed box in (d). (f) Higher magnification of the region outlined by the solid box in (d). (g) More extensive bleeding (black arrow) and severe structural damage to cord tracts (red arrow). (h) Higher magnification of the region outlined by the dashed box in (g) showcasing spinal cord tissue disintegration. (i) Higher magnification of the region outlined by the solid box in (g).
Fig. 2
Fig. 2
Incidence of RBC extravasation observed in tumor and healthy treated tissue across different pressure levels.
Fig. 3
Fig. 3
Comparison of RBC area in healthy tissue across varying pressure conditions. (a) Boxplot showing the quantification of RBC area in treated healthy tissues, indicating an increase with rising pressure. (b) Representative H&E-stained histological image at 1.2 MPa illustrating extensive tissue damage, yet a reduced presence of RBCs in the damaged region.
Fig. 4
Fig. 4
Representative H&E-stained histological images of tumor tissue illustrating key features across different treatment conditions. (a) RBC extravasation and proteinaceous fluid-filled cavities within the tumor tissue in the sham group. (bd) Magnified views of the regions marked by dashed boxes in (a), showing (b) a proteinaceous fluid-filled cavity, (c) RBC extravasation, and (d) a proteinaceous fluid lake containing floating RBCs. (e) A representative tumor treated at 0.4 MPa, showing cavities filled with proteinaceous fluid and cell debris, with relatively well-defined margins. (f) A magnified view of the region marked by the dashed box in (e). (g) Another representative tumor treated at 0.4 MPa, exhibiting RBC extravasation. (h) A magnified view of the region marked by the dashed box in (g). (i) A representative tumor treated at 0.8 MPa. (j,k) Magnified views of regions marked by dashed boxes in (i), illustrating (j) a proteinaceous fluid-filled region and (k) RBC extravasation. (l) Another representative tumor treated at 0.8 MPa, demonstrating RBC extravasation. (m) A representative tumor treated at 1.2 MPa, showing cavities filled with proteinaceous fluid and floating RBCs. (n) A magnified view of the region marked by the dashed box in (m). (o) Another representative tumor treated at 1.2 MPa, showing cavities containing abundant cell debris. (p) A magnified view of the region marked by the dashed box in (o). The dotted brown lines in (a), (e), (g), (i), (l), (m), and (o) delineate the approximate tumor margins.
Fig. 5
Fig. 5
Quantitative analysis of histopathological features in tumor tissue across varying pressure conditions. (a) Area of proteinaceous fluid-filled cavities containing cell debris in the tumor. (b) Area of RBCs normalized to the tumor size to adjust for the fact that larger tumors likely have a greater baseline of RBC presence. (c) The absolute RBC area in the tumor. The boxplots in (a), (b) and (c) do not indicate any statistically significant trends or meaningful patterns between these features and the applied pressure conditions. (d) RBC area in healthy and tumor tissue shown side by side for comparison, with healthy tissue exhibiting roughly an order of magnitude greater RBC presence. Direct statistical comparison of these groups may not be appropriate as it may imply a misleading equivalence between two biologically distinct environments. Tumor’s spontaneous leakage, an its elevated interstitial fluid pressure which can restrict RBC extravasation as well as differences in vascular structure and feeding patterns of tumor and healthy tissue further complicates direct comparison of RBC area in the two tissue types.
Fig. 6
Fig. 6
The differential sensitivity of healthy tissue and tumor tissue to ultrasound treatment at 0.8 MPa. (a) Evidence of vascular damage (black arrows) in the healthy tissue surrounding the tumor, with the tumor tissue remaining intact, highlighting the increased sensitivity of the healthy tissue to the applied pressure. (b) Higher magnification of the region outlined by the dashed box in (a). (c) Higher magnification of the region outlined by the solid box in (a).
Fig. 7
Fig. 7
Representative histological images illustrating low vascularity and cellular heterogeneity in tumor tissue. (a) A representative tumor section showing low vascularity and heterogeneous cell morphology. (b) Higher magnification of the region boxed in (a), highlighting the varied cell morphology. (c) CD31-stained section adjacent to the H&E-stained section in the tissue block, demonstrating minimal detectable vascular structures.
Fig. 8
Fig. 8
TUNEL and H&E staining on immediately adjacent tissue sections treated at 1.2 MPa. (a) TUNEL-stained slide where apoptotic nuclei are expected but not present (black arrows), suggesting that 24 h was insufficient for apoptosis to be detectable. (b) H&E-stained slide from the adjacent section showing significant tissue damage.
Fig. 9
Fig. 9
CD31-positive area as an indicator of vascularity in grey matter, white matter, and tumor tissue. Vascularity is significantly higher in healthy tissue (both grey and white matter) compared to tumor (****p < 0.00001, *p < 0.05).
Fig. 10
Fig. 10
CD31-positive vessels stained with DAB, along with selected vessel diameter measurements to illustrate differences in vessel size across tissue types. (a) Healthy tissue, dark brown staining indicates endothelium. (b) Higher magnification of the region outlined by the dashed box in (a); increased vascularity is observed in the grey matter on the right side of the red dashed line, compared to the white matter on the left. (c) Higher magnification of the region outlined by the solid box in (b); vessel diameters are consistently below 10 µm in this sample. (d) Tumor tissue exhibiting high cellularity with densely packed tumor cells. (e) Higher magnification of the region outlined by the dashed box in (d). (f) Higher magnification of the region outlined by the solid box in (e); vessel diameters are consistently above 10 µm in this sample. (g) Tumor tissue exhibiting heterogeneous cell populations and proteinaceous fluid. (h) Higher magnification of the region outlined by the dashed box in (g). The red dashed line delineates the tumor boundary. Increased vascularity is observed in the healthy tissue adjacent to the tumor. (i) Higher magnification of the area marked by the solid box in (h), showing a single large-diameter vessel within the tumor.
Fig. 11
Fig. 11
Simplified schematic of the experimental setup and workflow.

Similar articles

References

    1. Dijkmans, P. A. et al. Microbubbles and ultrasound: From diagnosis to therapy. Eur. J. Echocardiogr.5, 245–246 (2004). - PubMed
    1. Holland, C. K. & Apfel, R. E. Fundamentals of the mechanical index and caveats in its application. J. Acoust. Soc. Am.105, 1324 (1999).
    1. Chowdhury, S. M., Abou-Elkacem, L., Lee, T., Dahl, J. & Lutz, A. M. Ultrasound and microbubble mediated therapeutic delivery: Underlying mechanisms and future outlook. J. Control. Release326, 75–90 (2020). - PubMed
    1. Wang, T.-Y., Wilson, K. E., Machtaler, S. & Willmann, J. K. Ultrasound and microbubble guided drug delivery: Mechanistic understanding and clinical implications. Curr. Pharm. Biotechnol.14, 743–752 (2013). - PMC - PubMed
    1. McMahon, D., O’Reilly, M. A. & Hynynen, K. Therapeutic agent delivery across the blood–brain barrier using focused ultrasound. Annu. Rev. Biomed. Eng.23, 89–113 (2021). - PMC - PubMed

Publication types

LinkOut - more resources