. 2025 Aug 29;15(1):31841.
doi: 10.1038/s41598-025-16766-z.

ADAPT-3D:accelerated deep adaptable processing of tissue for 3-dimensional fluorescence tissue imaging for research and clinical settings

Affiliations

ADAPT-3D:accelerated deep adaptable processing of tissue for 3-dimensional fluorescence tissue imaging for research and clinical settings

Daniel D Lee et al. Sci Rep. .

Erratum in

Abstract

Light sheet microscopy and preparative clearing methods that improve light penetration in 3D tissues have revolutionized imaging in biomedical research. Here we present ADAPT-3D, a streamlined 3-step approach to turn tissues optically transparent while preserving tissue architecture with the versatility to handle diverse tissue sizes and types across species. Unlike extensive lipid removal utilized by existing protocols, ADAPT-3D only partially removes lipids to preserve cell membranes, yet the non-toxic aqueous refractive indexing solution still rapidly turns tissues transparent while preserving the fluorescence of endogenous and antibody conjugated fluorophores. ADAPT-3D prepares whole mouse brains for light sheet microscopy in a 4-hour refractive indexing step after less than 4 days of preprocessing without changing their size. By maintaining tissue size, ADAPT-3D clears 1-mm thick brain slices in under 24 h without causing damage and facilitates a 3D section-like view of the meandering choroid plexus. We applied ADAPT-3D to overcome challenges of whole mouse skull clearing and visualized the undisturbed brain borders including specialized skull channels after just 8 days of tissue preparation. ADAPT-3D also had utility in clearing and immunolabeling human intestinal tissues in about 5 days. Overall, ADAPT-3D provides a high-speed, non-shrinking, and fluorescence-preserving workflow for 3D imaging that bridges section-based and whole-organ studies, offering new opportunities for biological discovery.


Conflict of interest statement

Declarations. Competing interests: Washington University and D.D.L., D.L.D., R.S.C., B.H.Z., and G.J.R. have filed a provisional patent on ADAPT-3D. ADAPT-3D solutions are being commercially developed by Leinco Technologies, Inc., Saint Louis, Missouri ( https://www.leinco.com ). J. K. is cofounder of Rho Bio that aims to develop therapeutics for the lymphatic vasculature. Other authors declare no competing interests.

Figures
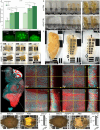
Fig. 1
Fig. 1
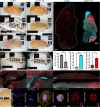
ADAPT-3D tissue processing and refractive index matching render tissues optically transparent without shrinkage. (A) Comparison of fluorescent intensities of CD11c-eYFP follicles in Peyer’s patches of mouse ileum following different fixative conditions and captured by stereomicroscopy. Indicated are averages ± 1 standard error of mean (n = 4–5 follicles per condition, two-way ANOVA followed by Tukey test, *p-value ≤ 0.05, **p-value ≤ 0.01), average). (B) Luminal side of fixed 600 μm thick mouse colons decolorized overnight (left) or left unprocessed (right) shown before (top) and after (bottom) a 60-minute incubation in ADAPT:RI. (C) Full thickness [1.5–2 mm] cross sections of fixed human colon untreated (top) or incubated in ADAPT:RI for 10 min (bottom) without decolorization or delipidation. (D) Fixed mouse and piglet colon incubated for 60 min in ADAPT:DC, 60 min in ADAPT:PDL (left) and then incubated in ADAPT:RI for 30–60 min. (E) Fixed 1-mm brain slice from a LysMCre;tdTomatofl/fl mouse before ADAPT-3D processing. (F) The same section after 6 h of ADAPT: DC followed by 5 h of ADAPT:RI but without delipidation or (G) another section treated the same except for the addition of a 3-hour incubation in ADAPT:PDL before viewing immersed in ADAPT:RI. (H) Tiled confocal image of a single plane from a 1 mm section with a LysMCre;tdTomatofl/fl reporter (red) and nuclei stained with anti-histone antibody (cyan). (I) Confocal acquired fluorescent z-stacks of the brain stem and (J) cerebral cortex from the 1 mm section shown in F without ADAPT:PDL treatment (left) or from the 1 mm section shown in G with 3 h of ADAPT:PDL treatment (right). (K) Before and after top-down stereoscope image of fixed whole mouse brain and corresponding quantification of the brain area for duplicate samples following the iDISCO + method including 4 h of RIM in ethyl cinnamate or (L) following ADAPT-3D tissue processing consisting of 48 h ADAPT:DC, 36 h ADAPT:PDL, and 4 h ADAPT:RI. Dashed lines on graph in K and L link paired samples before and after. ** in J indicates the location of the corpus callosum.
Fig. 2
Fig. 2
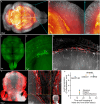
ADAPT-3D maintains tissue integrity and fluorescence intensity for accurate 3D imaging without excessive lipid removal. (A) Stereoscope images of 1-mm fixed brain slice from a LysMCre;TdTomatofl/fl mouse before treatment (top), immediately after 12 h in CUBIC-L at 37 °C (middle), and after washing out of CUBIC-L buffer (bottom). (B) Matched brain slice from the contralateral hemisphere to that in A before treatment (top), captured immediately after 12 h in ADAPT:PDL (middle), and after washing out of ADAPT:PDL (bottom). (C) Stereoscope image of CUBIC processed 1 mm section from A after immersion in CUBIC-R+(M) for 4 h (left) and the ADAPT-3D processed 1 mm section from B after immersion ADAPT: RI for 4 h (right). (D) Tile scanned confocal image of the first in focus plane of the CUBIC processed section (left) and of the ADAPT-3D processed section (right) acquired with matched acquisition settings and displayed with equivalent scaling. (E) The area of CUBIC and ADAPT-3D processed sections measured from tiled confocal fluorescent images using imageJ software. (F) The mean fluorescence intensity of anti-Histone-ATTO488 and (G) of endogenous TdTomato in tiled confocal images acquired from sections processed with either CUBIC or ADAPT-3D (two-tailed unpaired t-test, standard error of mean bars, *p-value ≤ 0.05, *** p-value ≤ 0.001, ****p-value ≤ 0.0001). (H) Zoomed in view of the lateral and 3rd ventricle in the CUBIC processed section from D that was increased in brightness to be visible and (I) of the choroid plexus in the lateral ventricle of the ADAPT-3D processed section from D. (J) The leptomeninges on the cortical edge of a section processed with CUBIC vs. (K) a section processed with ADAPT-3D. * in panel J indicates 1 of multiple sites of leptomeningeal tearing. (L) Stereoscope image of white matter in matched sections where one was treated for 3 h with CUBIC-L at 37 °C (top) and the other with ADAPT:PDL for 3 h (bottom) that were washed out of their respective delipidation buffers. (M) Fixed peritoneal fluid cells from LysMcre;Abca1fl/flAbcg1fl/fl mice untreated (left) or incubated in ADAPT:PDL for 15 min (right) and stained with LipidSpot 610. (N) Representative image of CellBrite Orange staining for membrane lipids in fixed cells from peritoneal fluid without delipidation (left) or after a 15-minute incubation in ADAPT:PDL (right). (O) Representative image of EEA1 staining for endosomes in fixed cells from peritoneal fluid without delipidation (left) or after a 15-minute incubation in ADAPT:PDL (right) where combined endosomal and nuclear staining is shown as an inset.
Fig. 3
Fig. 3
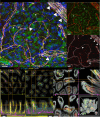
Light sheet imaging of the whole mouse brain and of connections at the skull-brain interface visualized using endogenous fluorophores preserved by ADAPT-3D. (A) 3D whole-mount projection of the brain from a ChATCre;tdTomatofl/fl mouse (white) injected retro-orbitally with Lectin-Dylight649 to label vasculature (fire) acquired by light sheet microscopy. (B) Extended display near lateral ventricle from (A) displaying blood vessels in the core of the brain and preservation of fine neuron dendrites in the cortex. (C) 3D whole-mount projection of a brain from a 16-week old mouse expressing CD11c-eYFP which was decolorized, delipidated, and incubated in ADAPT:RI followed by imaging with light sheet microscopy. (D) 500-micron coronal maximum intensity projection from whole brain of CD11c-eYFP where white arrow points to a CD11c-positive neuron. (E) A 50-micron x-y maximum intensity projection of the brain borders from a light sheet image of the whole skull from a Lyve1CreER;tdTomatofl/fl (red) mouse injected i.v. with Lectin-Dylight649 and CD31-AF647 to label blood vessels (white). The layers of the brain borders are annotated with the following abbreviations: muscle [MS], skull [SK], dura mater [D], leptomeninges [LM], and brain parenchyma [B]. (F) Dorsal view of the light sheet imaging volume acquired from the whole skull in E where arrowheads point to dural lymphatics and full arrows point to meningeal macrophages. (G) Extended display of Lyve1 positive skull channels where the asterisk denotes consecutive skull channels bridging the skull bone marrow and meninges. (H) A graphical depiction of the relationship between the depth of light penetration in light sheet images of intact mouse skulls and the corresponding tissue preparation times reported for the different clearing protocols in the literature including the 8-day time frame determined here for ADAPT-3D.
Fig. 4
Fig. 4
Effect of ADAPT-3D on finicky antigens and compatibility with deep immunolabeling. A) Maximum intensity projections of tight junctions (arachnoid barrier: occludin in red and claudin-11 in green, endothelial-cell specific: claudin-5 in grey) found in leptomeninges from a wildtype mouse imaged by confocal microscopy. B) Extended display showing en face and x-z projections of mouse ileum that was immunolabeled with alpha smooth muscle actin (yellow), lymphatic vasculature (LYVE-1, magenta), myeloid cells (S100A9, cyan), and nuclei (DAPI, grey) followed by imaging with confocal microscopy. C) Extended display showing en face and x-z projections of ileum from a 16-week-old mouse that expresses TNFΔARE, a model of ileitis. D) Extended display showing en face, z-side, and 3D projections of fixed human ileum applied with decolorization, delipidation, immunolabeling with CD163 (green), IBA1 (red), and nuclei (DAPI, grey) followed by refractive index matching.

Update of

References

    1. Daetwyler, S. & Fiolka, R. P. Light-sheets and smart microscopy, an exciting future is dawning. Commun. Biol.6, 502 (2023). - PMC - PubMed
    1. Chung, K. & Deisseroth, K. CLARITY for mapping the nervous system. Nat. Methods. 10, 508–513 (2013). - PubMed
    1. Chung, K. et al. Structural and molecular interrogation of intact biological systems. Nature497, 332–337 (2013). - PMC - PubMed
    1. Yang, B. et al. Single-cell phenotyping within transparent intact tissue through whole-body clearing. Cell158, 945–958 (2014). - PMC - PubMed
    1. Nudell, V. et al. HYBRiD: hydrogel-reinforced DISCO for clearing mammalian bodies. Nat. Methods. 19, 479–485 (2022). - PMC - PubMed

LinkOut - more resources