Longitudinal retinal functional evaluation using full-field electroretinography in New Zealand white and Dutch Belted rabbits with aging
- PMID: 40883602
- PMCID: PMC12397238
- DOI: 10.1038/s41598-025-17856-8
Longitudinal retinal functional evaluation using full-field electroretinography in New Zealand white and Dutch Belted rabbits with aging
Abstract
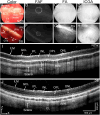
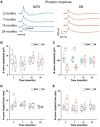
Electroretinography (ERG) is pivotal in elucidating retinal function, yet investigations into the temporal dynamics of ERG signals in New Zealand White (NZW) and Dutch-belted (DB) rabbits remain scarce. This study presents a longitudinal assessment of retinal function in both NZW and DB strains. ERG recordings were conducted on four NZW and four DB rabbits at 2, 7, 15, and 24 months of age, encompassing both dark-adapted and light-adapted protocols at each time point. Quantitative analyses included assessment of a- and b-wave amplitudes, implicit times, and photopic flicker responses. Results revealed consistently stronger a- and b-wave amplitudes in NZW rabbits compared to DB rabbits across all time points. These stronger ERG responses likely result from increased effective light exposure at the photoreceptor level in NZW rabbits, rather than indicating intrinsic differences in retinal sensitivity. Over time, NZW rabbits showed a decline in visual function of the cone and postreceptoral systems, with the rod system less affected. In contrast, the visual function of DB rabbits initially improved at an early stage, followed by a slight decline after 15 months. The differences between the two strains may be attributed to the varying speeds of retinal maturation, melanin's absorption of light, and its protective effect against light-induced retinal damage. This dataset underscores the differential retinal characteristics between NZW and DB rabbits, shedding light on their distinct functional profiles.
© 2025. The Author(s).
Conflict of interest statement
Declarations. Competing Interests: Y.E. Chen and D. Yang are contractors and have financial interest in GeneToBe Inc, Ann Arbor, MI, a private entity that develops genetic eye and other translational disease models for the purpose of traditional and gene therapeutic prevention, treatment, and cures. Y.E. Chen is a co-founder of the entity. All the other authors declare that they have no competing interests.
Figures


Similar articles
-
Prescription of Controlled Substances: Benefits and Risks.2025 Jul 6. In: StatPearls [Internet]. Treasure Island (FL): StatPearls Publishing; 2025 Jan–. 2025 Jul 6. In: StatPearls [Internet]. Treasure Island (FL): StatPearls Publishing; 2025 Jan–. PMID: 30726003 Free Books & Documents.
-
Light-adapted electroretinograms of eyes with cataract recorded using the HE-2000 system before and after mydriasis.Sci Rep. 2025 Jul 9;15(1):24695. doi: 10.1038/s41598-025-08340-4. Sci Rep. 2025. PMID: 40634367 Free PMC article.
-
NTP Developmental and Reproductive Toxicity Technical Report on the Prenatal Development Studies of 2-((1-(4-Phenoxyphenoxy)propan-2-yl)oxy)pyridine (CASRN 95737-68-1) in Sprague Dawley (Hsd:Sprague Dawley® SD®) Rats and New Zealand White (Hra:NZW SPF) Rabbits: DART Report 07 [Internet].Research Triangle Park (NC): National Toxicology Program; 2022 Jan. Research Triangle Park (NC): National Toxicology Program; 2022 Jan. PMID: 35593777 Free Books & Documents. Review.
-
Six Years and Counting: Restoration of Photopic Retinal Function and Visual Behavior Following Gene Augmentation Therapy in a Sheep Model of CNGA3 Achromatopsia.Hum Gene Ther. 2018 Dec;29(12):1376-1386. doi: 10.1089/hum.2018.076. Epub 2018 Jul 30. Hum Gene Ther. 2018. PMID: 29926749 Free PMC article.
-
The Road towards Gene Therapy for X-Linked Juvenile Retinoschisis: A Systematic Review of Preclinical Gene Therapy in Cell-Based and Rodent Models of XLRS.Int J Mol Sci. 2024 Jan 19;25(2):1267. doi: 10.3390/ijms25021267. Int J Mol Sci. 2024. PMID: 38279267 Free PMC article.
References
-
- Behn, D. et al. Dark adaptation is faster in pigmented than albino rats. Doc. Ophthalmol.106, 153–159 (2003). - PubMed
-
- Charng, J., Nguyen, C. T., Bui, B. V. & Vingrys, A. J. Age-related retinal function changes in albino and pigmented rats. Investig. Ophthalmol. Vis. Sci.52, 8891–8899 (2011). - PubMed
MeSH terms
Grants and funding
- R01 EY034325/EY/NEI NIH HHS/United States
- 1R01EY033000/U.S. Department of Health & Human Services | NIH | National Eye Institute (NEI)
- R01 HL147527/HL/NHLBI NIH HHS/United States
- 1R42EY035582-01/U.S. Department of Health & Human Services | NIH | National Eye Institute (NEI)
- K08 EY027458/EY/NEI NIH HHS/United States
- R01 EY033000/EY/NEI NIH HHS/United States
- R01-HL147527/Foundation for the National Institutes of Health (Foundation for the National Institutes of Health, Inc.)
- R21 GM140359-01/Foundation for the National Institutes of Health (Foundation for the National Institutes of Health, Inc.)
- R21 GM140359/GM/NIGMS NIH HHS/United States
- 1K08EY027458/U.S. Department of Health & Human Services | NIH | National Eye Institute (NEI)
- P30 EY001765/EY/NEI NIH HHS/United States
- 1R42EY035582/U.S. Department of Health & Human Services | NIH | National Human Genome Research Institute (NHGRI)
- R01EY034325/U.S. Department of Health & Human Services | NIH | National Eye Institute (NEI)
- R42 EY035582/EY/NEI NIH HHS/United States
LinkOut - more resources
Full Text Sources
Medical
Miscellaneous

